The Electrocardiogram (ECG), a diagnostic tool, provides valuable insights into cardiac function. Accurately interpreting an ECG rhythm strip is a crucial skill for professionals trained in institutions and for Paramedics on the front lines. The Heart Rhythm Society emphasizes quick and efficient evaluation of ECG strips to facilitate rapid intervention in critical situations. One method of quick evaluation is understanding the 6 second ecg, a process that simplifies rate calculation. Our guide provides the skills needed to master 6 second ecg interpretation, ensuring you can quickly assess cardiac rhythms in various clinical settings.
The Power of the 6-Second ECG: A Critical Tool for Rapid Cardiac Assessment
The 6-second electrocardiogram (ECG) is a vital tool in modern healthcare, particularly in emergency situations. It offers a rapid snapshot of cardiac electrical activity, allowing healthcare professionals to quickly assess a patient’s heart rhythm and identify potential life-threatening conditions.
This abbreviated ECG strip, representing just six seconds of heart activity, provides crucial information in a time-sensitive manner, enabling swift intervention and potentially improving patient outcomes.
The 6-Second ECG: A Snapshot in Time
A standard ECG records the electrical activity of the heart over a period of time, typically 10 seconds. The 6-second ECG is a truncated version, focusing on providing essential data for rapid interpretation.
In emergency settings, where every second counts, the 6-second ECG offers a significant advantage. It allows for a quicker assessment of heart rate and rhythm compared to analyzing a full 10-second strip. This speed is paramount when dealing with patients experiencing chest pain, shortness of breath, or other symptoms suggestive of cardiac compromise.
The 6-second ECG serves as a crucial initial screening tool, guiding immediate treatment decisions and informing the need for further, more comprehensive cardiac evaluation.
Why Master the 6-Second ECG? Benefits for Healthcare Professionals
Mastering the interpretation of the 6-second ECG is a highly valuable skill for a wide range of healthcare professionals. From paramedics and emergency medical technicians (EMTs) to nurses and physicians, the ability to quickly and accurately analyze a 6-second ECG can significantly impact patient care.
- For first responders, the 6-second ECG can help determine the urgency of a situation and guide pre-hospital treatment protocols.
- Emergency room nurses can use it to triage patients efficiently and prioritize those with critical cardiac conditions.
- Physicians can leverage the 6-second ECG to make rapid diagnoses and initiate appropriate therapies.
- For cardiology technicians it is another tool to understand a rhythm.
Beyond emergency situations, the 6-second ECG is also beneficial in various clinical settings, including primary care offices and urgent care centers. Its ease of use and rapid interpretation make it a valuable tool for monitoring patients with known cardiac conditions or assessing those presenting with new or concerning symptoms.
The 6-second ECG is not intended to replace a full 12-lead ECG when more comprehensive analysis is required. Instead, it serves as a rapid assessment tool, providing essential information quickly to guide initial management decisions.
For healthcare professionals, the ability to rapidly assess a patient’s cardiac status can be the difference between life and death. The 6-second ECG provides that crucial initial assessment. But before diving into interpretation, it’s important to establish a solid understanding of the fundamental components that make up an ECG and how they are displayed on the ECG paper itself.
ECG Essentials: Understanding the Basics
A strong foundation in ECG basics is critical for accurate interpretation. This includes understanding what the 6-second strip represents in terms of time, how to use the markings on ECG paper for measurement, and the physiological significance of each waveform. Let’s explore these essential elements.
The 6-Second Snapshot
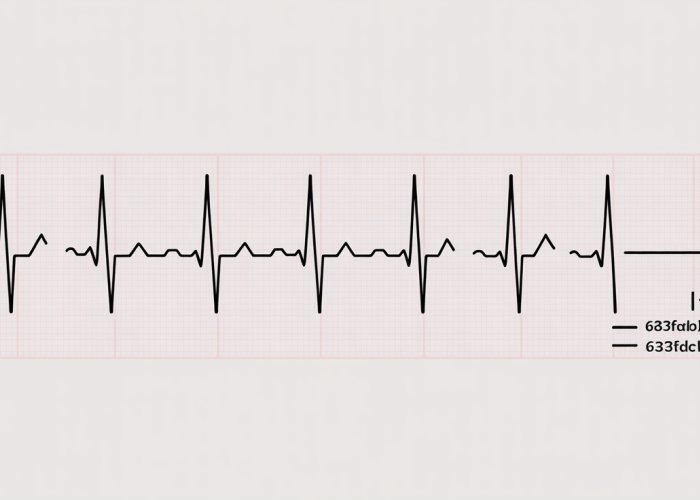
The 6-second ECG strip offers a brief but informative window into the heart’s electrical activity.
It captures six seconds of continuous cardiac cycles.
This snapshot allows healthcare professionals to quickly evaluate the heart’s rhythm and rate, providing essential information for immediate clinical decision-making.
Decoding ECG Paper Markings
ECG paper is specifically designed with a grid of horizontal and vertical lines.
These markings are essential for measuring time and voltage, both critical for accurate ECG interpretation.
Small squares, each measuring 1 mm by 1 mm, represent 0.04 seconds horizontally and 0.1 mV vertically.
Five small squares make up a larger square, representing 0.20 seconds horizontally and 0.5 mV vertically.
By understanding these measurements, clinicians can accurately assess the duration of waveforms and intervals, aiding in the identification of abnormalities.
The Anatomy of an ECG Complex: P Wave, QRS Complex, and T Wave
The ECG tracing is composed of distinct waveforms.
Each waveform corresponds to a specific phase of the cardiac cycle.
Understanding the physiological significance of the P wave, QRS complex, and T wave is paramount for accurate interpretation.
The P Wave: Atrial Depolarization
The P wave represents atrial depolarization, the electrical activity that causes the atria to contract.
A normal P wave is upright and smooth.
Abnormalities in the P wave, such as changes in shape or amplitude, may indicate atrial enlargement or other atrial abnormalities.
The QRS Complex: Ventricular Depolarization
The QRS complex represents ventricular depolarization, the electrical activity that triggers ventricular contraction.
It is typically the most prominent feature on the ECG tracing.
The morphology of the QRS complex, including its width and amplitude, can provide valuable information about ventricular function and the presence of conduction abnormalities. A widened QRS complex, for instance, may indicate a bundle branch block.
The T Wave: Ventricular Repolarization
The T wave represents ventricular repolarization, the process by which the ventricles return to their resting state.
The T wave should typically be upright and slightly asymmetrical.
Abnormalities in the T wave, such as inversion or peaking, may indicate myocardial ischemia or other cardiac conditions.
Having established a firm grounding in the fundamental components of the ECG and the meaning behind the paper’s markings, we can now proceed to practical application. Understanding the components is only half the battle; the real value lies in the ability to interpret that information and derive meaningful clinical insights.
Step-by-Step: Interpreting a 6-Second ECG
This section will guide you through a systematic approach to interpreting a 6-second ECG strip. Each step builds upon the previous, enabling you to quickly and accurately assess crucial aspects of a patient’s cardiac function. By following this method, you’ll gain the confidence to identify normal rhythms, detect abnormalities, and ultimately contribute to timely and effective patient care.
Step 1: Calculate the Heart Rate
The first step in ECG interpretation is to determine the heart rate. The 6-second strip method provides a rapid and reasonably accurate way to estimate this vital parameter.
The 6-Second Strip Method
This method leverages the fact that the ECG strip represents six seconds of continuous heart activity. To calculate the heart rate, count the number of complete QRS complexes present on the 6-second strip and multiply that number by 10.
For example, if you count 7 QRS complexes, the estimated heart rate is 70 beats per minute (7 x 10 = 70).
Quick Estimation Techniques
While the 6-second method is useful, it’s not always precise, especially with irregular rhythms. For faster, albeit less accurate, estimations, you can use landmarks on the ECG paper. Remember, on standard ECG paper, five large squares equal one second.
If one QRS complex is approximately one large square away from the next, the heart rate is around 300 bpm. Two large squares equates to approximately 150 bpm, three large squares to 100 bpm, four large squares to 75 bpm, and five large squares to 60 bpm. These estimations are helpful for quickly gauging the rate but should be followed up with more accurate calculations when possible.
Step 2: Assess the Rhythm
After determining the heart rate, the next crucial step is to evaluate the rhythm. This involves assessing the regularity of the QRS complexes. Is the rhythm consistent, or are there irregular intervals between beats?
Determining Rhythm Regularity
A regular rhythm is characterized by consistent intervals between successive QRS complexes. Use calipers, if available, or the edge of a piece of paper to mark the distance between several QRS complexes. Then, compare these measurements across the entire strip. If the intervals are consistently the same, the rhythm is considered regular.
An irregular rhythm, conversely, exhibits varying intervals between QRS complexes. This irregularity can be regularly irregular (a repeating pattern of irregularity) or irregularly irregular (no discernible pattern).
Patterns in Rhythm Analysis
When assessing rhythm, look for specific patterns that might indicate underlying cardiac conditions. For example, a regularly irregular rhythm might suggest second-degree AV block, while an irregularly irregular rhythm is commonly associated with atrial fibrillation.
Also, note the presence or absence of P waves before each QRS complex. The relationship between P waves and QRS complexes provides valuable insight into the origin and conduction pathway of the heart’s electrical activity.
Step 3: Analyze the Waves and Intervals
The final step involves a detailed analysis of the individual waveforms and intervals that make up each cardiac cycle. This includes the P wave, PR interval, QRS complex, QT interval, and T wave.
P Wave
Assess the P wave for its presence, morphology (shape), and regularity. A normal P wave is upright in most leads and indicates atrial depolarization. Absent, inverted, or abnormally shaped P waves may indicate atrial abnormalities or ectopic pacemakers. The presence of a consistent P wave before each QRS complex suggests that the sinus node is the primary pacemaker.
PR Interval
The PR interval represents the time it takes for the electrical impulse to travel from the atria to the ventricles through the AV node. Measure the PR interval from the beginning of the P wave to the beginning of the QRS complex. The normal PR interval ranges from 0.12 to 0.20 seconds (3 to 5 small squares).
A prolonged PR interval suggests a first-degree AV block, indicating slowed conduction through the AV node. A shortened PR interval may indicate pre-excitation syndromes like Wolff-Parkinson-White.
QRS Complex
The QRS complex represents ventricular depolarization. Assess the width and morphology of the QRS complex. A normal QRS complex is typically less than 0.12 seconds (3 small squares) in duration.
A widened QRS complex may indicate a bundle branch block, ventricular hypertrophy, or ventricular ectopic beats. Abnormal QRS morphology can also suggest myocardial infarction or other structural heart diseases.
QT Interval
The QT interval represents the total time for ventricular depolarization and repolarization. Measure the QT interval from the beginning of the QRS complex to the end of the T wave. The QT interval is rate-dependent and should be corrected for heart rate using formulas like Bazett’s formula (QTc).
Prolonged QT intervals increase the risk of ventricular arrhythmias, such as Torsades de Pointes. Shortened QT intervals can be associated with hypercalcemia or certain genetic conditions.
T Wave
The T wave represents ventricular repolarization. Assess the T wave for its morphology, amplitude, and direction. Normal T waves are usually upright and slightly asymmetrical.
Inverted T waves may indicate myocardial ischemia or infarction. Peaked T waves can be seen in hyperkalemia. Flattened or biphasic T waves can be associated with electrolyte imbalances or cardiac ischemia.
Having mastered the fundamental skills of ECG interpretation, including heart rate calculation, rhythm assessment, and waveform analysis, you’re now equipped to tackle the more challenging task of identifying arrhythmias. Recognizing abnormal heart rhythms is crucial for prompt diagnosis and intervention, potentially averting serious complications. This section serves as your guide to decoding common arrhythmias on a 6-second ECG strip.
Decoding Arrhythmias: Recognizing Common Patterns
This section focuses on identifying common arrhythmias on a 6-second ECG strip. It provides clear descriptions and examples of sinus arrhythmias, atrial fibrillation, and other frequently encountered rhythm disturbances.
Sinus Arrhythmias: Tachycardia and Bradycardia
Sinus arrhythmias originate in the sinoatrial (SA) node, the heart’s natural pacemaker. While often benign, they can indicate underlying physiological stress or pathological conditions. Recognizing the characteristics of Sinus Tachycardia and Sinus Bradycardia is fundamental.
Sinus Tachycardia
Sinus Tachycardia is defined by a heart rate greater than 100 beats per minute (bpm), originating from the SA node.
On a 6-second ECG, you’ll observe more than 10 QRS complexes, as each QRS complex represents a heartbeat. The P waves will be present and upright in lead II, preceding each QRS complex, confirming the sinus origin.
Possible causes include exercise, fever, anxiety, dehydration, pain, and certain medications. It can also be a compensatory mechanism in conditions like hypoxia or hypovolemia.
Sinus Bradycardia
Sinus Bradycardia is characterized by a heart rate less than 60 bpm, still originating from the SA node.
On a 6-second ECG, you’ll count fewer than 6 QRS complexes. As with Sinus Tachycardia, P waves are present and upright in lead II and precede each QRS complex.
Common causes include physical fitness (especially in athletes), sleep, medication side effects (e.g., beta-blockers), and certain medical conditions like hypothyroidism or increased intracranial pressure. In some individuals, it may be a normal variant, while in others, it can cause symptoms like dizziness or fatigue.
Atrial Fibrillation: The Irregularly Irregular Rhythm
Atrial Fibrillation (AFib) is one of the most common arrhythmias encountered in clinical practice. Its hallmark is an irregularly irregular rhythm, resulting from chaotic electrical activity in the atria.
Recognizing Atrial Fibrillation on a 6-Second ECG
The most striking feature of AFib is the absence of discernible P waves. Instead, you’ll observe fibrillatory waves (f-waves), which are rapid, irregular, and often difficult to distinguish.
The R-R intervals are completely irregular, meaning the distance between consecutive QRS complexes varies unpredictably. This irregularity is the key to identifying AFib. The ventricular rate (the rate at which the ventricles are contracting) can be slow, normal, or rapid, depending on the conduction through the AV node.
Other Common Arrhythmias
Beyond sinus arrhythmias and atrial fibrillation, other arrhythmias can be identified on a 6-second ECG strip. Keep in mind that accurate diagnosis often requires a longer ECG recording or rhythm strip, but the 6-second ECG can provide a crucial initial clue.
Premature Ventricular Contractions (PVCs)
PVCs are early, wide, and bizarre-looking QRS complexes that occur before the expected sinus beat. They are not preceded by a P wave and are often followed by a compensatory pause.
Supraventricular Tachycardia (SVT)
SVT is a rapid heart rhythm originating above the ventricles. The QRS complexes are usually narrow, and the heart rate is typically between 150 and 250 bpm. P waves may be difficult to identify, especially if the heart rate is very fast.
First-Degree AV Block
First-degree AV block is characterized by a prolonged PR interval (greater than 0.20 seconds), indicating delayed conduction through the AV node. Each P wave is still followed by a QRS complex, but the PR interval is consistently prolonged.
Having mastered the fundamental skills of ECG interpretation, including heart rate calculation, rhythm assessment, and waveform analysis, you’re now equipped to tackle the more challenging task of identifying arrhythmias. Recognizing abnormal heart rhythms is crucial for prompt diagnosis and intervention, potentially averting serious complications. This section serves as your guide to decoding common arrhythmias on a 6-second ECG strip.
Beyond the Basics: Advanced ECG Considerations
While the 6-second ECG strip offers a rapid snapshot of cardiac activity, it’s essential to recognize its limitations. The information gleaned from a brief tracing may not always provide a complete picture, especially when dealing with subtle or intermittent cardiac events. Understanding when to escalate concerns and how to integrate 6-second ECGs with more comprehensive monitoring strategies are vital components of advanced ECG interpretation.
Recognizing Red Flags: When to Seek Expert Consultation
Not every rhythm disturbance can be definitively diagnosed or managed based solely on a 6-second ECG. Certain findings should immediately raise suspicion for more complex underlying cardiac pathologies, prompting consultation with a cardiologist or experienced electrophysiologist.
Significant ST-segment changes, such as elevation or depression, particularly in the presence of chest pain or other ischemic symptoms, warrant immediate attention. These changes may indicate acute myocardial infarction or severe myocardial ischemia, requiring rapid intervention.
Similarly, wide QRS complexes that are not consistently present, or QRS complexes that exhibit bizarre morphologies, may suggest ventricular tachycardia or pre-excitation syndromes like Wolff-Parkinson-White (WPW). Such findings necessitate further evaluation to determine the underlying mechanism and guide appropriate management.
Furthermore, any high-degree AV block, especially Mobitz Type II second-degree AV block or complete heart block, observed on a 6-second ECG requires prompt assessment. These blocks can rapidly progress to symptomatic bradycardia or asystole, demanding immediate intervention, such as transcutaneous pacing.
Ultimately, clinical context is paramount. Even seemingly benign arrhythmias should be viewed with caution in patients presenting with significant symptoms like syncope, near-syncope, or unexplained dyspnea. A high index of suspicion, combined with a thorough clinical assessment, is crucial for identifying patients who require more advanced cardiac evaluation.
The Power of Continuous Cardiac Monitoring
While a 6-second ECG provides a valuable glimpse into a patient’s cardiac rhythm, it only captures a fleeting moment in time. Continuous cardiac monitoring offers a dynamic and comprehensive view of cardiac activity, revealing patterns and trends that may be missed by intermittent assessments.
In settings like intensive care units (ICUs) or telemetry units, continuous ECG monitoring is indispensable for detecting subtle arrhythmias, assessing the efficacy of antiarrhythmic medications, and identifying potential complications following cardiac interventions. By continuously tracking the heart’s electrical activity, clinicians can rapidly respond to changes in rhythm, preventing potentially life-threatening events.
The integration of 6-second ECGs with continuous monitoring data offers a powerful approach to cardiac assessment. A 6-second ECG can be used to confirm or clarify findings observed on the continuous monitor, providing a more detailed analysis of specific rhythm disturbances.
Furthermore, regular 6-second ECG recordings can serve as a baseline for comparison, allowing clinicians to track changes in cardiac rhythm over time. This longitudinal perspective is particularly valuable in patients with chronic heart conditions or those at high risk for arrhythmias.
Interpreting Interval Durations: PR and QT
Beyond rhythm and morphology, the intervals between waveforms on an ECG provide critical clues about underlying cardiac conduction and repolarization. The PR interval reflects the time required for atrial depolarization to reach the ventricles, while the QT interval represents the duration of ventricular repolarization.
Prolonged PR Interval
A prolonged PR interval, typically defined as greater than 0.20 seconds (200 milliseconds), indicates a delay in AV conduction. This can be caused by a variety of factors, including medications (e.g., beta-blockers, calcium channel blockers, digoxin), electrolyte imbalances (e.g., hyperkalemia), or structural heart disease.
First-degree AV block, characterized by a consistently prolonged PR interval with each P wave followed by a QRS complex, is often asymptomatic and may not require specific treatment. However, a markedly prolonged PR interval can increase the risk of developing more advanced AV blocks.
Shortened PR Interval
Conversely, a shortened PR interval, typically less than 0.12 seconds (120 milliseconds), may suggest pre-excitation syndromes like WPW. In WPW, an accessory pathway bypasses the AV node, allowing atrial impulses to reach the ventricles more rapidly.
This can lead to characteristic ECG findings, such as a short PR interval, a delta wave (a slurred upstroke of the QRS complex), and a widened QRS complex. Recognizing WPW is crucial, as patients with this condition are at risk for developing rapid, life-threatening arrhythmias, such as AV re-entrant tachycardia.
Prolonged QT Interval
A prolonged QT interval is a significant concern, as it increases the risk of developing torsades de pointes, a potentially fatal ventricular arrhythmia. QT prolongation can be congenital (e.g., long QT syndrome) or acquired, often due to medications (e.g., antiarrhythmics, antipsychotics, antibiotics), electrolyte imbalances (e.g., hypokalemia, hypomagnesemia), or underlying cardiac conditions.
The QT interval should be corrected for heart rate using formulas like Bazett’s formula (QTc = QT / √RR) to account for the effect of heart rate on repolarization. A QTc interval greater than 450 milliseconds in males or 470 milliseconds in females is generally considered prolonged.
Shortened QT Interval
A shortened QT interval is less common than QT prolongation, but it can also be clinically significant. It may be associated with hypercalcemia, digoxin toxicity, or certain genetic conditions. A markedly shortened QT interval can increase the risk of developing atrial or ventricular arrhythmias.
By carefully assessing PR and QT intervals on the 6-second ECG, clinicians can gain valuable insights into a patient’s cardiac conduction and repolarization properties, identifying potential risks and guiding appropriate management strategies.
FAQs: Mastering the 6-Second ECG
This FAQ section provides quick answers to common questions about interpreting 6-second ECG strips, based on the ultimate, speedy guide.
Why use a 6-second ECG strip at all?
The 6-second ECG strip offers a fast and efficient way to estimate the heart rate. By counting the number of QRS complexes and multiplying by 10, you get an approximate heart rate, useful for rapid assessment.
Is the 6-second ECG heart rate always accurate?
While convenient, it’s an estimation. It’s most accurate for regular rhythms. For irregular rhythms, a longer ECG strip or an average over time is needed for a more precise heart rate.
What if the QRS complex falls exactly on the end of the 6-second ECG strip?
If a QRS complex is right at the end, include it in your count. This gives the most accurate estimate based on your 6-second ecg reading.
Where do I find the "6-second markers" on the ECG strip?
Most ECG machines print time markers at regular intervals, often indicating 3-second increments. Two of these 3-second markings give you the 6-second interval needed for your quick 6-second ecg interpretation.
Alright, you’ve got the basics of the 6 second ecg under your belt! Go practice and you’ll be a pro in no time!