Contours, a fundamental concept in cartography, visually represent equal values across a geographical area. Understanding them is crucial for interpreting spatial data. Meanwhile, **GIS (Geographic Information Systems)** software allows for the easy creation and manipulation of isolines. These tools facilitate detailed analyses based on different **types of isolines**, from topographic maps illustrating elevation to weather maps showing temperature gradients. Eduard Imhof, a renowned cartographer, significantly contributed to understanding how to visualize terrain using isolines, highlighting their ability to convey three-dimensional landscapes on two-dimensional surfaces. Mastering these visualization methods empowers insights across diverse scientific and practical applications.
Decoding Isolines: A Comprehensive Guide to Their Types
This article aims to provide a thorough understanding of isolines, focusing particularly on the different types of isolines and their applications. We’ll break down the concept of isolines, then delve into specific types you need to know.
What are Isolines? A Foundational Understanding
Isolines are lines drawn on a map or chart that connect points of equal value. Imagine a landscape; isolines are like contour lines, but instead of just elevation, they can represent anything measurable like temperature, pressure, or rainfall. The core purpose of isolines is to visually represent a continuous distribution of data, making it easier to identify patterns and trends.
- Key Concept: Constant Value Connection
- Visual Representation: Lines connecting points of equal data
- Purpose: Simplifying data interpretation and identifying spatial patterns
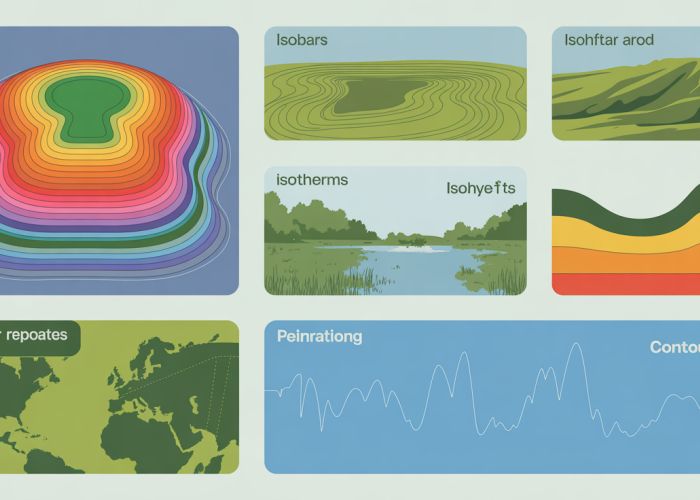
Types of Isolines: Core Distinctions
This is the main section, elaborating on the core topic: types of isolines. We will cover the most important and frequently encountered types.
Isobars: Lines of Constant Pressure
Isobars are isolines that connect points of equal atmospheric pressure. These are commonly seen on weather maps and are crucial for understanding weather patterns.
- Definition: Lines representing equal atmospheric pressure.
- Unit of Measurement: Typically measured in hectopascals (hPa) or millibars (mb).
- Significance: Closely spaced isobars indicate a steep pressure gradient, which often corresponds to strong winds. Widely spaced isobars mean a weak pressure gradient and calmer conditions.
Isotherms: Lines of Constant Temperature
Isotherms connect points of equal temperature. They are used in meteorology, climatology, and even oceanography to visualize temperature distributions.
- Definition: Lines representing equal temperature.
- Unit of Measurement: Measured in degrees Celsius (°C) or Fahrenheit (°F).
- Significance: Isotherms help identify areas of warm or cold air masses and track their movement. They can also indicate ocean currents or land surface temperatures.
Isohyets: Lines of Constant Rainfall
Isohyets connect points of equal rainfall over a given period. They are used in hydrology, agriculture, and water resource management.
- Definition: Lines representing equal amounts of rainfall.
- Unit of Measurement: Measured in millimeters (mm) or inches (in).
- Significance: Isohyets help visualize rainfall patterns and identify areas of drought or flooding. They are essential for planning irrigation systems and managing water resources.
Contours: Lines of Constant Elevation
Contours, also known as topographic contours, connect points of equal elevation above a reference level, usually sea level. They are fundamental in cartography and geography.
- Definition: Lines representing equal elevation.
- Unit of Measurement: Measured in meters (m) or feet (ft).
- Significance: Contours provide a three-dimensional representation of the terrain on a two-dimensional map. They indicate the steepness of slopes and the shape of landforms.
Isopachs: Lines of Constant Thickness
Isopachs represent lines of equal thickness. They are commonly used in geology and sedimentology to map the thickness of sedimentary layers or geological formations.
- Definition: Lines representing equal thickness of a layer.
- Unit of Measurement: Measured in meters (m) or feet (ft).
- Significance: Isopachs help geologists understand the depositional history of an area and identify potential hydrocarbon reservoirs.
Practical Applications of Isolines
The utility of isolines extends far beyond mere map reading. Their application spans numerous fields:
- Weather Forecasting: Predicting weather patterns using isobars and isotherms.
- Resource Management: Managing water resources using isohyets.
- Geological Surveys: Identifying geological formations using isopachs.
- Urban Planning: Assessing flood risks and land suitability using contours.
- Environmental Monitoring: Tracking pollution levels using isolines of pollutant concentration.
Visual Interpretation: Reading Isolines Like a Pro
Understanding the spacing and patterns of isolines is key to extracting meaningful information:
- Close Spacing: Indicates a rapid change in the value being represented (e.g., a steep slope if contours, a strong pressure gradient if isobars).
- Wide Spacing: Indicates a gradual change in the value being represented (e.g., a gentle slope if contours, a weak pressure gradient if isobars).
- Circular or Concentric Patterns: Often indicate a local maximum or minimum (e.g., a hill if contours, a high-pressure system if isobars).
A Quick Reference Table: Types of Isolines
| Isoline Type | Represents | Common Application(s) | Key Interpretation Hint |
|---|---|---|---|
| Isobars | Atmospheric Pressure | Weather forecasting, climate analysis | Closely spaced: Strong winds; Widely spaced: Calm winds |
| Isotherms | Temperature | Climate analysis, oceanography | Helps identify warm/cold air masses |
| Isohyets | Rainfall Amount | Hydrology, agriculture | Identifies areas of drought or flooding |
| Contours | Elevation | Topographic mapping, urban planning | Provides 3D terrain representation on a 2D map |
| Isopachs | Layer Thickness | Geology, sedimentology | Aids in understanding depositional history |
Frequently Asked Questions About Isolines
Here are some common questions about isolines to help you better understand and utilize them in data visualization and analysis.
What exactly is an isoline?
An isoline is a line on a map or chart connecting points of equal value. It represents a constant quantity, such as temperature, elevation, or pressure. Isolines help visualize data distribution across a geographical area.
What are the main types of isolines, and how do they differ?
Several types of isolines exist, including isobars (pressure), isotherms (temperature), isohyets (rainfall), and contours (elevation). The key difference lies in the variable being represented. For instance, isotherms show temperature variations, while contours depict elevation changes.
Why are types of isolines useful?
Isolines simplify complex data by representing it visually. They reveal patterns and trends that might be difficult to discern from raw data. They enable quick identification of areas with high or low values, helping in decision-making across various fields like meteorology, geography, and urban planning.
How can I interpret crowded versus widely spaced types of isolines?
Crowded isolines indicate a rapid change in the variable being mapped. Conversely, widely spaced isolines suggest a gradual change or a more uniform distribution. Therefore, the spacing between isolines provides valuable insights into the rate of change of the represented data.
Alright, hope you got a good grasp on **types of isolines**! Now go out there and put that knowledge to good use. See ya!