Understanding first order processes is crucial in various domains, from chemical kinetics to systems engineering. The time constant, a key attribute, defines the speed of response in these processes. Examining the principles of first order process behavior offers valuable insight for organizations like Process Control Solutions Inc. in optimizing their systems. This comprehensive guide explores the intricate details of the first order process, providing an in-depth analysis of its characteristics and applications.
In the vast landscape of engineering and scientific disciplines, some systems exhibit a fundamental behavior known as a first-order process. Understanding these processes is crucial for effective control, optimization, and prediction of system behavior across numerous applications.
This article serves as your comprehensive guide to unraveling the secrets of first-order processes. We will define what these processes are, explore their significance in diverse fields, and demonstrate why a solid grasp of their characteristics is essential for anyone involved in process control and optimization.
What is a First-Order Process?
At its core, a first-order process is a dynamic system whose response to a change in input is characterized by a single dominant time constant. This means the system’s output changes exponentially over time until it reaches a new steady state.
Think of it like this: imagine heating a cup of coffee. The temperature of the coffee doesn’t instantly jump to its final value; instead, it gradually increases, following an exponential curve. This gradual change, governed by a single time constant, is a hallmark of a first-order process.
The Breadth of First-Order Processes
First-order processes are pervasive in various fields. From electrical circuits to thermal systems, from chemical reactions to fluid dynamics, you’ll find examples of first-order behavior all around you. Understanding these processes allows engineers and scientists to:
- Predict the behavior of a system under various conditions.
- Design effective control strategies to achieve desired outcomes.
- Optimize system performance for maximum efficiency.
Why Are First-Order Processes Important?
The importance of understanding first-order processes stems from their prevalence and their role as building blocks for more complex systems.
Many real-world systems can be accurately modeled as first-order processes, allowing for simplified analysis and control design.
Furthermore, even complex systems can often be approximated as a series of interconnected first-order processes. Therefore, a deep understanding of first-order behavior provides a foundation for analyzing and controlling more complicated systems.
Importance for Control System Design and Optimization
First-order processes are foundational in control system design and optimization. Control engineers leverage their understanding of these processes to design controllers that:
- Stabilize the system
- Achieve desired performance specifications (e.g., response time, overshoot)
- Minimize the effects of disturbances
By accurately modeling a system as a first-order process, control engineers can use well-established techniques to design effective controllers, leading to improved system performance and efficiency.
Roadmap of This Article
This article is structured to provide you with a thorough understanding of first-order processes. We will embark on a journey that covers the following key areas:
- The mathematical representation of first-order processes using differential equations and transfer functions.
- The significance of key parameters such as the time constant and gain.
- Step response analysis, a fundamental technique for characterizing system behavior.
- Frequency response analysis using Bode plots.
- Real-world applications of first-order processes in various fields.
- The use of the Laplace transform as a powerful tool for analysis.
By the end of this article, you will have a solid understanding of first-order processes and their importance in engineering and science. You’ll be equipped with the knowledge and tools necessary to analyze, control, and optimize systems exhibiting first-order behavior.
The importance of understanding first-order processes has been made clear. Now, let’s solidify our grasp of these processes by diving into the mathematical tools that allow us to describe and analyze them. The ability to represent these dynamic systems mathematically is the key to predicting their behavior and designing effective control strategies.
Fundamentals: Delving into the Mathematical Representation
To truly understand first-order processes, it is essential to explore the mathematical framework that governs their behavior. This involves understanding the differential equation representation and the concept of the transfer function. These are the fundamental building blocks that allow engineers and scientists to model, analyze, and control these pervasive systems.
The Differential Equation: Describing System Dynamics
At the heart of every first-order process lies a differential equation. This equation mathematically describes the relationship between the input, output, and rate of change of the output.
The general form of a first-order linear time-invariant (LTI) differential equation is:
τ dy(t)/dt + y(t) = K u(t)
Where:
- y(t) represents the output of the system as a function of time.
- u(t) represents the input of the system as a function of time.
- τ is the time constant, which we’ll discuss in detail later.
- K is the gain, also to be discussed in detail.
This equation states that the rate of change of the output (dy(t)/dt), multiplied by the time constant (τ), plus the output itself (y(t)), is equal to the gain (K) multiplied by the input (u(t)). This simple equation encapsulates the essence of a first-order process.
The differential equation is a time-domain representation of the system. It describes how the output changes with respect to time in response to a given input.
The Transfer Function: A Frequency-Domain Perspective
While the differential equation provides a time-domain view of the system, the transfer function offers a frequency-domain perspective. The transfer function is a mathematical representation of the system that describes the relationship between the input and output in the Laplace domain (s-domain).
Defining the Transfer Function
The transfer function, denoted by G(s), is defined as the ratio of the Laplace transform of the output, Y(s), to the Laplace transform of the input, U(s), assuming zero initial conditions:
G(s) = Y(s) / U(s)
The s-domain is a mathematical space where we can analyze the system’s behavior in terms of frequency rather than time. This is incredibly useful for understanding how the system responds to different frequencies of input signals.
Deriving the Transfer Function
To obtain the transfer function from the differential equation, we apply the Laplace transform to both sides of the equation. Assuming zero initial conditions, the Laplace transform of the derivative dy(t)/dt becomes sY(s). Applying the Laplace transform to the differential equation:
τ sY(s) + Y(s) = K U(s)
Now, we can rearrange the equation to solve for the transfer function G(s) = Y(s) / U(s):
G(s) = K / (τs + 1)
This is the standard form of the transfer function for a first-order process.
Components of the Transfer Function
The transfer function, G(s) = K / (τs + 1), has two key components:
-
Numerator: The numerator is simply the gain, K. It represents the steady-state gain of the system, which is the ratio of the change in output to the change in input at steady state.
-
Denominator: The denominator is (τs + 1). The time constant, τ, appears in the denominator, directly influencing the system’s dynamic behavior. The root of the denominator, s = -1/τ, is the pole of the transfer function and determines the stability and speed of response of the system.
The transfer function provides a concise and powerful way to represent a first-order process. It encapsulates the system’s dynamic characteristics in a single mathematical expression. Understanding the transfer function is crucial for analyzing system stability, designing controllers, and predicting system performance.
The preceding sections have laid the groundwork for understanding first-order processes. Now, we turn our attention to the two pivotal parameters that dictate their behavior: the time constant and the gain. These parameters are not merely abstract mathematical constructs; they embody the inherent characteristics of the system and directly influence its response to changes in input.
Key Parameters: Time Constant and Gain Explained
The time constant and gain are the essential fingerprints of a first-order process. Understanding these parameters is crucial for predicting how the system will respond to various inputs and for designing effective control strategies.
Understanding the Time Constant (τ)
The time constant, denoted by the Greek letter τ (tau), is arguably the most critical parameter in characterizing a first-order process. It governs how quickly the system responds to a change in input.
Defining the Time Constant
The time constant (τ) is a measure of the time it takes for a system to reach approximately 63.2% of its final value after a step change in input.
This percentage is derived from the mathematical properties of the exponential function that governs the response of a first-order system.
The Physical Meaning of the Time Constant
Physically, the time constant represents the inertia or resistance to change within the system. A smaller time constant indicates a faster response, meaning the system adapts quickly to changes.
Conversely, a larger time constant implies a slower response, indicating that the system is more sluggish in reacting to input changes.
Imagine filling a water tank: a narrow pipe (high resistance) results in a large time constant and slow filling, while a wide pipe (low resistance) yields a small time constant and rapid filling.
Influence on System Response Speed
The time constant directly dictates the speed of the system’s response. A system with a small time constant will react quickly to changes in input, reaching its new steady state relatively rapidly.
In contrast, a system with a large time constant will respond more slowly, taking longer to settle at its final value. This distinction is crucial in applications where responsiveness is paramount, such as in control systems for robotics or aerospace.
Understanding the Gain (K)
The gain, often denoted by K, defines the relationship between the input and the output of the system at steady state.
Defining the Gain
The gain (K) represents the ratio of the change in the steady-state output to the change in the input. It essentially scales the input signal to produce the output signal.
The Physical Meaning of the Gain
Physically, the gain represents the sensitivity of the system. It indicates how much the output will change for a given change in the input, once the system has reached a steady state.
A high gain means that a small change in input will result in a large change in output, making the system very responsive to input variations.
A low gain, conversely, indicates that even a significant change in input will only produce a small change in output.
Impact on Output Magnitude
The gain directly affects the magnitude of the output signal. If the gain is greater than one (K > 1), the output will be larger than the input, amplifying the signal.
If the gain is less than one (K < 1), the output will be smaller than the input, attenuating the signal. If the gain is exactly one (K = 1), the output will be equal to the input.
Understanding the time constant and gain is crucial for designing and controlling first-order processes effectively. They provide valuable insights into the system’s dynamics and allow engineers to predict and manipulate its behavior for optimal performance.
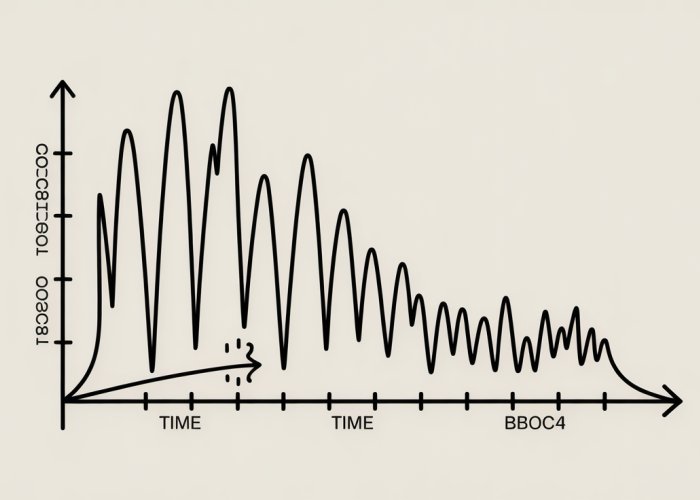
Step Response Analysis: Unveiling the System’s Dynamic Behavior
Having established the fundamental parameters governing first-order processes, understanding how these systems behave under specific conditions becomes paramount. The step response provides a powerful lens through which to observe a system’s dynamic characteristics, revealing its responsiveness and stability in the face of sudden changes.
Defining the Step Response
The step response is the system’s output when the input is a step function—an instantaneous change from one level to another.
Imagine suddenly switching a valve fully open, or instantly changing the setpoint on a temperature controller. The step response plots the system’s reaction to this abrupt shift over time. Analyzing this response reveals crucial insights into the system’s speed, stability, and overall behavior.
Rise Time: Gauging System Responsiveness
What is Rise Time?
Rise time is a critical metric that quantifies how quickly a system responds to a step input. Specifically, it is defined as the time it takes for the output to rise from 10% to 90% of its final, steady-state value.
Significance of Rise Time
A shorter rise time indicates a more responsive system, capable of reacting quickly to changes in the input.
Conversely, a longer rise time suggests a sluggish system that is slow to adapt. This parameter is crucial in applications where rapid response is critical, such as in control systems where timely adjustments are necessary to maintain desired performance.
Settling Time: Assessing Process Stability
Defining Settling Time
Settling time provides insights into how long it takes for the system’s output to settle within a certain percentage (typically 2% or 5%) of its final value after a step change.
Settling Time and Stability
A shorter settling time implies greater stability, indicating that the system quickly reaches its steady-state value without excessive oscillations.
Conversely, a longer settling time may suggest potential instability or a tendency to oscillate before reaching equilibrium. Understanding settling time is crucial for designing stable and reliable control systems that can maintain desired performance without unwanted fluctuations.
Steady State: Achieving Equilibrium
Understanding Steady State
Steady state refers to the condition where the system’s output has reached a constant value and no longer changes with time.
In the context of a step response, the steady state represents the final value that the output reaches after the transient effects of the step change have subsided.
Reaching Steady State
A first-order system asymptotically approaches its steady-state value. The output gets closer and closer to the final value, but theoretically never fully reaches it in finite time.
However, for practical purposes, we consider the system to have reached steady state when it is within a small tolerance band around the final value. The speed at which the system approaches steady state is directly related to the time constant, with a smaller time constant leading to a faster approach to equilibrium.
Having explored the system’s reaction to a sudden, step-like change, a crucial aspect of understanding any dynamic system lies in examining its response to varying frequencies. This is where frequency response analysis comes into play, offering a different perspective on system behavior.
Frequency Response: Analyzing System Behavior Across Frequencies
Frequency response analysis is a powerful technique for characterizing how a system reacts to sinusoidal inputs of different frequencies. Rather than observing the transient response to a step input, it reveals the system’s behavior under continuous, oscillating conditions. This perspective is invaluable for designing control systems and predicting performance under complex operating scenarios.
Understanding Frequency Response Analysis
Frequency response analysis involves subjecting the system to sinusoidal inputs across a range of frequencies and observing the resulting output.
Key parameters of interest are the magnitude ratio (the ratio of the output amplitude to the input amplitude) and the phase shift (the difference in phase between the input and output signals).
The magnitude ratio indicates how much the system amplifies or attenuates the input signal at a given frequency. A phase shift indicates the time delay introduced by the system at that frequency.
These parameters are typically plotted against frequency on a Bode plot, which provides a comprehensive visual representation of the system’s frequency response.
The Bode Plot: A Visual Tool for Analysis
The Bode plot is a graphical representation of a system’s frequency response, consisting of two plots:
-
Magnitude Plot: This plot shows the magnitude ratio (typically expressed in decibels) as a function of frequency (typically plotted on a logarithmic scale).
-
Phase Plot: This plot shows the phase shift (in degrees) as a function of frequency (also on a logarithmic scale).
By examining the Bode plot, one can readily identify key characteristics of the system’s frequency response, such as the bandwidth, resonant peaks, and phase margins.
Analyzing a First-Order Process Using the Bode Plot
For a first-order process, the Bode plot exhibits characteristic features that are directly related to the system’s time constant (τ) and gain (K).
-
Low Frequencies: At low frequencies (frequencies much smaller than 1/τ), the magnitude ratio is approximately equal to the gain (K), and the phase shift is close to zero degrees. This means that the system passes low-frequency signals with minimal attenuation or phase shift.
-
Corner Frequency: At the corner frequency (ω = 1/τ), the magnitude ratio is attenuated by approximately 3 dB (corresponding to a factor of 0.707), and the phase shift is -45 degrees. This frequency marks the transition between the low-frequency and high-frequency behavior of the system.
-
High Frequencies: At high frequencies (frequencies much larger than 1/τ), the magnitude ratio decreases with increasing frequency at a rate of -20 dB per decade, and the phase shift approaches -90 degrees. This indicates that the system attenuates high-frequency signals and introduces a significant phase lag.
Process Response to Different Input Frequencies
Understanding how a first-order process responds to different input frequencies is crucial for various applications.
-
Slow Variations: For slowly varying inputs (low frequencies), the system responds relatively quickly and accurately, with minimal attenuation or delay.
-
Rapid Variations: For rapidly varying inputs (high frequencies), the system struggles to keep up, resulting in significant attenuation and delay. This can lead to poor performance in applications where rapid response is required.
By analyzing the frequency response, engineers can design appropriate control strategies to compensate for the limitations of the first-order process and achieve desired performance objectives. For example, they might incorporate lead or lag compensators to improve the system’s bandwidth and phase margin.
Having explored the system’s reaction to a sudden, step-like change, a crucial aspect of understanding any dynamic system lies in examining its response to varying frequencies. This is where frequency response analysis comes into play, offering a different perspective on system behavior.
Real-World Applications: Examples in Action
Theoretical understanding of first-order processes is greatly enhanced by recognizing their presence in everyday scenarios and engineering applications. This section aims to bridge the gap between theory and practice by showcasing several tangible examples. These illustrations solidify understanding and demonstrate the broad applicability of first-order process knowledge.
Heating Systems: Temperature Control in Action
Consider a simple heating system, such as a room heated by a radiator. The radiator emits heat at a rate proportional to the difference between its temperature and the room temperature. This heat transfer process can be effectively modeled as a first-order system.
The input is the heat supplied by the radiator, and the output is the room temperature. The time constant in this scenario represents the thermal capacitance of the room and its contents, and the thermal resistance to the surroundings.
The smaller the time constant, the faster the room temperature responds to changes in the radiator’s heat output. Understanding this first-order behavior allows for the design of effective temperature control systems.
RC Circuits: First-Order Systems in Electronics
RC circuits, consisting of a resistor and a capacitor, are fundamental building blocks in electronics and serve as excellent examples of first-order systems. When a voltage is applied to an RC circuit, the capacitor charges or discharges through the resistor. The voltage across the capacitor exhibits a characteristic exponential response.
The time constant (τ) for an RC circuit is simply the product of the resistance (R) and capacitance (C): τ = RC. This time constant determines how quickly the capacitor charges or discharges.
RC circuits find wide application in filtering, timing circuits, and signal conditioning. Understanding their first-order behavior is critical for designing and analyzing electronic systems.
Mixing Processes: Blending and Dilution Dynamics
Mixing processes, common in chemical engineering and food processing, can often be approximated as first-order systems. Consider a tank where a concentrated solution is diluted by a continuous flow of solvent. The concentration of the solution in the tank changes over time as mixing occurs.
Assuming perfect mixing, the concentration of the tank can be modeled as a first-order process. The time constant in this case is related to the volume of the tank and the flow rate of the solvent. Knowing the time constant allows us to predict how quickly the concentration will reach a desired level. This is crucial for maintaining product quality and process efficiency.
Level Control in Tanks: A Simplified Model
Maintaining a desired liquid level in a tank is a common control problem. While the complete system can be more complex, a simplified model often treats the tank level as a first-order process, especially when the outflow is relatively constant or controlled by a valve with a relatively fast response.
The inflow rate acts as the input, and the tank level is the output. The time constant is related to the cross-sectional area of the tank and the outflow rate. Although a simplification, this first-order model provides valuable insights for designing basic level control strategies.
Chemical Reactors: First-Order Kinetics
Many chemical reactions follow first-order kinetics, where the rate of the reaction is directly proportional to the concentration of a single reactant. In a well-mixed batch reactor, the concentration of the reactant decreases exponentially with time.
The time constant is the inverse of the rate constant (k) for the reaction (τ = 1/k). This relationship is fundamental in reactor design, allowing chemical engineers to predict conversion rates and optimize reaction times.
Temperature Sensors: Response Time Considerations
Many temperature sensors, such as thermocouples and RTDs (Resistance Temperature Detectors), exhibit a first-order response to changes in temperature. When the temperature of the environment surrounding the sensor changes, the sensor’s internal temperature doesn’t change instantaneously.
The sensor’s temperature gradually approaches the environmental temperature. The time constant of the sensor determines how quickly it responds to changes. A smaller time constant means a faster response and more accurate measurement of rapidly changing temperatures. This is a critical factor when selecting sensors for dynamic temperature monitoring applications.
Having explored the system’s reaction to a sudden, step-like change, a crucial aspect of understanding any dynamic system lies in examining its response to varying frequencies. This is where frequency response analysis comes into play, offering a different perspective on system behavior. From analyzing system stability to designing effective control strategies, understanding how a system reacts to different frequencies is indispensable. Building upon our foundation, let’s introduce a powerful mathematical tool that greatly simplifies the analysis of these systems: the Laplace transform.
Laplace Transform: A Powerful Tool for Analysis
The Laplace transform is a mathematical tool that converts differential equations, which describe the behavior of dynamic systems in the time domain, into algebraic equations in the complex frequency domain (s-domain). This transformation dramatically simplifies the analysis and solution of these equations, making it an indispensable tool for engineers and scientists working with dynamic systems.
At its core, the Laplace transform is an integral transform that maps a function of time, f(t), to a function of complex frequency, F(s). The transform is defined as:
F(s) = ∫₀^∞ f(t)e^(-st) dt
where s is a complex variable (s = σ + jω), t represents time, and the integral is taken from zero to infinity. The result, F(s), is the Laplace transform of f(t).
This seemingly simple transformation has profound implications. It allows us to represent differential equations, which are often difficult to solve directly, as algebraic equations in the s-domain. Algebraic equations are far easier to manipulate and solve, providing a pathway to understanding the system’s behavior without grappling with the complexities of differential equations.
Simplifying Analysis with the Laplace Transform
The real power of the Laplace transform lies in its ability to convert differential equations into algebraic equations. Consider a general first-order differential equation:
τ dy(t)/dt + y(t) = K u(t)
where:
- y(t) is the output variable
- u(t) is the input variable
- τ is the time constant
- K is the gain
Applying the Laplace transform to both sides of this equation, using the properties of linearity and differentiation, we obtain:
τ [sY(s) – y(0)] + Y(s) = K U(s)
Here, Y(s) and U(s) are the Laplace transforms of y(t) and u(t), respectively, and y(0) is the initial condition of y(t).
Notice how the derivative dy(t)/dt has been transformed into a simple algebraic term, sY(s). This transformation eliminates the complexities of differentiation, making the equation much easier to manipulate.
Solving Differential Equations in the s-Domain
The algebraic equation in the s-domain can now be solved for Y(s):
Y(s) = (K U(s) + τ y(0)) / (τ * s + 1)
This expression represents the output Y(s) in terms of the input U(s), the initial condition y(0), and the system parameters τ and K.
To obtain the time-domain response y(t), we apply the inverse Laplace transform to Y(s):
y(t) = L⁻¹{Y(s)}
The inverse Laplace transform converts the function in the s-domain back into a function of time. This process, while sometimes requiring the use of partial fraction decomposition and Laplace transform tables, provides the solution to the original differential equation.
Advantages of Using the Laplace Transform
Using the Laplace transform offers several key advantages:
- Simplification: Converts differential equations into algebraic equations.
- Handles Initial Conditions: Easily incorporates initial conditions into the solution.
- Frequency Domain Analysis: Provides insights into system behavior in the frequency domain.
- System Stability: Enables the determination of system stability using techniques like pole-zero analysis.
By leveraging the Laplace transform, engineers and scientists can effectively analyze and design control systems, predict system responses, and optimize system performance, all with a more manageable mathematical framework.
FAQs about First Order Processes
This section answers frequently asked questions to further clarify the concepts explained in our guide to first order processes.
What exactly defines a "first order" process?
A first order process is characterized by a rate of change that’s directly proportional to the current state of the system. Think of it like this: the faster something is happening now, the faster it will slow down. The key is the single rate constant governing the speed of the process.
How do I identify a first order process in real-world scenarios?
Look for exponential decay or growth patterns. Examples include the cooling of an object, radioactive decay, or charging/discharging a capacitor. The defining feature is that the rate of change decreases as time goes on, following a predictable curve that can be modeled by a first order process.
What are some common applications of first order process models?
First order process models are used extensively in chemical kinetics, physics, and engineering. They help predict the behavior of simple systems like reactions, heat transfer, and electrical circuits. Understanding them provides a base for modelling more complex scenarios.
What is the significance of the time constant in a first order process?
The time constant (often denoted as ‘τ’) is a crucial parameter. It represents the time it takes for the system to reach approximately 63.2% of its final value. It directly indicates how quickly the first order process reaches completion, and provides a simple measure of reaction speed.
Alright, you’ve made it through the ultimate guide to the first order process! Hopefully, you’ve got a much clearer understanding now. Go out there and put that knowledge to good use – we’re rooting for you!