An electrocardiogram (ECG), a critical tool utilized by cardiologists, provides a visual representation of the heart’s electrical activity. Accurate ecg waves explanation is essential for diagnosing various cardiac conditions. Understanding the significance of each wave, segment, and interval, such as the PR interval, allows medical professionals to effectively interpret an ECG tracing. Proper analysis of ECG data, often facilitated by specialized software, enables clinicians to make informed decisions regarding patient care and treatment strategies.
The electrocardiogram (ECG), often referred to as an EKG, stands as a cornerstone in cardiovascular diagnostics. It offers a non-invasive window into the heart’s electrical activity, providing invaluable insights for clinicians. This intricate tracing, a visual representation of the heart’s rhythmic dance, can unveil a wealth of information.
From detecting subtle arrhythmias to identifying life-threatening myocardial infarctions, the ECG’s diagnostic power is undeniable.
The Indispensable Role of ECGs
The ECG’s importance stems from its ability to quickly and accurately assess various heart conditions. It is an indispensable tool in the diagnosis and management of arrhythmias, where the heart’s electrical impulses are irregular or improperly timed. An ECG can reveal the specific type of arrhythmia, guiding treatment decisions.
Furthermore, the ECG plays a crucial role in detecting myocardial ischemia and infarction. It can identify patterns indicative of reduced blood flow to the heart muscle, enabling timely intervention to prevent irreversible damage. Beyond these acute conditions, the ECG can also help detect structural heart abnormalities, electrolyte imbalances, and the effects of certain medications on the heart.
Our Mission: Unveiling the Secrets of ECG Waveforms
This article aims to serve as a comprehensive yet easily understandable guide to interpreting ECG waveforms. We recognize that ECG interpretation can be daunting, particularly for those new to the field.
Our goal is to demystify the process, breaking down each component of the ECG tracing into its fundamental elements. By providing clear explanations and visual aids, we empower readers to confidently identify and interpret various waveforms.
We delve into the significance of each wave, interval, and segment, offering insights into their normal characteristics and the implications of any deviations.
Who Will Benefit From This Guide?
This guide is designed to benefit a wide range of individuals:
- Medical students seeking a solid foundation in ECG interpretation will find it invaluable.
- Nurses who routinely encounter ECGs in their clinical practice will be able to sharpen their skills.
- Individuals with a general interest in learning about ECG readings will gain a deeper understanding of this essential diagnostic tool.
Regardless of your background, we strive to present the information in an accessible manner.
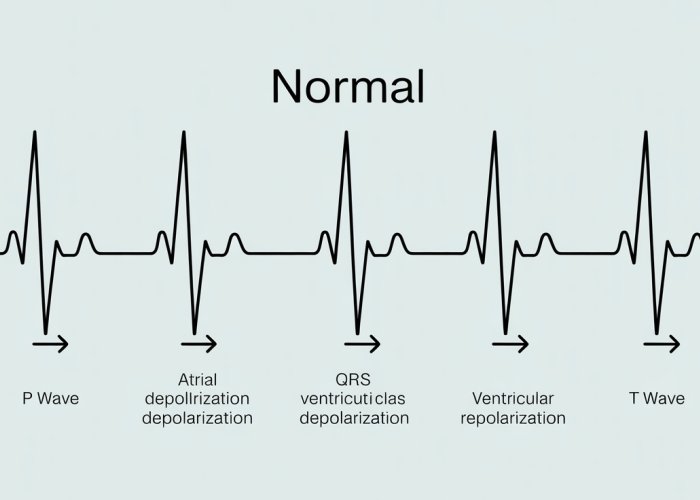
A Visual Gateway: The Normal ECG
To begin our journey, let’s introduce a visually engaging image of a normal ECG tracing. This serves as a reference point throughout our exploration of the heart’s electrical symphony.
[Insert visually appealing image of a normal ECG tracing here]
Each wave, each interval, each subtle deflection on this tracing tells a story about the heart’s health. As we delve deeper into the intricacies of ECG interpretation, remember this image as a symbol of the underlying principles we’ll be uncovering.
ECG Essentials: Understanding the Heart’s Electrical Language
Having established the ECG’s significance and the objectives of this guide, let’s delve into the foundational principles that underpin its operation. To truly grasp the meaning of the waveforms, it’s essential to understand what an ECG is, how it captures the heart’s electrical activity, and the intricacies of the cardiac conduction system. This section will lay the groundwork for interpreting the complex language of the ECG.
What is an ECG?
At its core, an electrocardiogram (ECG) is a non-invasive diagnostic tool that records the electrical activity of the heart over time. It doesn’t directly measure the mechanical contractions of the heart, but rather the electrical impulses that trigger these contractions.
Think of it as eavesdropping on the electrical conversations happening within your heart.
These conversations are crucial for coordinating the rhythmic pumping action that circulates blood throughout your body.
By capturing these electrical signals, the ECG provides a window into the heart’s function, allowing clinicians to identify abnormalities that may indicate underlying cardiac conditions.
How ECGs Capture Electrical Activity
The ECG machine utilizes electrodes placed on the patient’s limbs and chest to detect the tiny electrical currents generated by the heart.
These electrodes are connected to a galvanometer, which measures the voltage differences between different points on the body’s surface.
These voltage differences arise from the depolarization and repolarization of cardiac cells as electrical impulses travel through the heart.
The ECG machine then amplifies these signals and displays them as a waveform on a screen or prints them on paper.
The resulting tracing represents the summed electrical activity of all the heart muscle cells, providing a comprehensive view of the heart’s electrical behavior.
The Cardiac Conduction System: The Heart’s Internal Wiring
The heart’s electrical activity is not random; it’s meticulously orchestrated by a specialized network of cells called the cardiac conduction system. This system ensures that the heart beats in a coordinated and efficient manner.
Understanding the components of this system is crucial for interpreting ECG waveforms.
SA Node: The Heart’s Natural Pacemaker
The sinoatrial (SA) node, located in the right atrium, is the heart’s primary pacemaker. It spontaneously generates electrical impulses at a rate of 60-100 beats per minute, setting the heart’s rhythm.
These impulses then spread throughout the atria, causing them to contract. The SA node’s ability to automatically generate these electrical signals is what makes the heart beat independently.
AV Node: The Gatekeeper of Ventricular Activation
The atrioventricular (AV) node, located between the atria and ventricles, serves as a crucial relay station.
It delays the electrical signal slightly, allowing the atria to fully contract and empty their contents into the ventricles before ventricular contraction begins.
This delay is represented by the PR interval on the ECG. The AV node also acts as a protective mechanism, preventing excessively rapid atrial rhythms from being conducted to the ventricles.
Bundle of His: Bridging the Gap
From the AV node, the electrical signal travels down the Bundle of His, a specialized pathway that conducts the impulse to the ventricles.
The Bundle of His divides into left and right bundle branches, which further transmit the signal down the respective ventricles.
Purkinje Fibers: Spreading the Word
The bundle branches terminate in a network of Purkinje fibers, which rapidly distribute the electrical signal throughout the ventricular myocardium.
This rapid distribution ensures that the ventricles contract in a coordinated and forceful manner, efficiently pumping blood to the lungs and the rest of the body.
Understanding the precise sequence and timing of the cardiac conduction system is key to correctly interpreting ECG readings, allowing for informed clinical decisions and improved patient care.
Waveform Deconstruction: A Deep Dive into ECG Waves and Intervals
Having established the fundamental principles of ECGs and their ability to capture the heart’s electrical symphony, the next crucial step is learning to decipher the individual components of the ECG waveform. Each wave, interval, and segment represents a specific phase of the cardiac cycle, providing valuable insights into the heart’s function. Let’s embark on a detailed, section-by-section analysis of these components, understanding their normal characteristics and the clinical significance of any deviations.
The P Wave: Atrial Depolarization
The P wave is the first deflection from the baseline on an ECG tracing, representing the electrical activity associated with atrial depolarization.
Normal Characteristics of the P Wave
Normally, the P wave has a:
-
Duration: Less than 0.12 seconds (120 milliseconds).
-
Amplitude: Less than 2.5 mm (0.25 mV).
-
Morphology: Upright in leads I, II, and aVF, and inverted in lead aVR. It should be smooth and rounded.
P Wave Abnormalities and Clinical Significance
-
Peaked P waves: May indicate right atrial enlargement (P pulmonale), often seen in conditions like pulmonary hypertension or chronic lung disease.
-
Notched P waves: May indicate left atrial enlargement (P mitrale), often seen in mitral valve stenosis.
-
Absent P waves: May indicate atrial fibrillation or sinoatrial (SA) node dysfunction.
-
Inverted P waves (in leads where they should be upright): May suggest ectopic atrial rhythms or reversed lead placement.
The QRS Complex: Ventricular Depolarization
The QRS complex represents the electrical activity associated with ventricular depolarization, the process that triggers ventricular contraction. It is a critical component of the ECG, providing information about the size and function of the ventricles, as well as the integrity of the intraventricular conduction system.
Detailed Breakdown of the QRS Complex
The QRS complex is composed of three distinct deflections:
-
Q wave: The first negative deflection before a positive deflection.
-
R wave: The first positive deflection.
-
S wave: A negative deflection following the R wave.
Normal Characteristics of the QRS Complex
Normally, the QRS complex has a:
-
Duration: Less than 0.12 seconds (120 milliseconds). Prolongation suggests a conduction delay, such as a bundle branch block.
-
Amplitude: Variable, but generally larger than the P wave. Low voltage QRS complexes can be seen in conditions like pericardial effusion or obesity.
-
Morphology: Varies depending on the lead, but should be relatively narrow and sharply defined.
QRS Complex Abnormalities and Clinical Significance
-
Prolonged QRS duration: Indicates a delay in ventricular depolarization, often due to bundle branch blocks, ventricular pre-excitation (Wolff-Parkinson-White syndrome), or hyperkalemia.
-
Pathologic Q waves: Suggest previous myocardial infarction (heart attack). These Q waves are typically wider (≥ 0.04 seconds) and deeper (≥ 25% of the subsequent R wave amplitude).
-
Increased QRS amplitude: May indicate ventricular hypertrophy.
-
R wave progression: The R wave should gradually increase in amplitude from leads V1 to V6. Poor R wave progression can suggest previous anterior myocardial infarction.
The T Wave: Ventricular Repolarization
The T wave represents ventricular repolarization, the process where the ventricular muscle cells return to their resting state.
Normal Characteristics of the T Wave
-
Morphology: Usually upright, rounded, and slightly asymmetrical.
-
Amplitude: Variable, but generally smaller than the R wave.
T Wave Abnormalities and Clinical Significance
-
Tall, peaked T waves: Can be seen in hyperkalemia or early stages of myocardial infarction.
-
Inverted T waves: May indicate myocardial ischemia, infarction, or ventricular hypertrophy.
-
Flattened T waves: Can be caused by hypokalemia, hypomagnesemia, or medications.
-
T wave inversion in leads V1-V3: May be a normal variant (juvenile T-wave pattern) in some individuals, but can also be a sign of anterior ischemia or infarction.
The PR Interval: Atrioventricular Conduction Time
The PR interval represents the time from the beginning of atrial depolarization (P wave) to the beginning of ventricular depolarization (QRS complex).
Normal Duration of the PR Interval
The normal PR interval duration is between 0.12 and 0.20 seconds (120-200 milliseconds).
Significance of Prolonged or Shortened PR Interval
-
Prolonged PR interval (First-degree AV block): Indicates a delay in conduction through the AV node or His-Purkinje system.
-
Shortened PR interval: May be seen in Wolff-Parkinson-White syndrome (WPW), where an accessory pathway bypasses the AV node.
The ST Segment: Early Ventricular Repolarization
The ST segment represents the period between the end of ventricular depolarization (QRS complex) and the beginning of ventricular repolarization (T wave).
Normal Characteristics of the ST Segment
Normally, the ST segment is isoelectric, meaning it lies flat on the baseline.
ST Segment Elevation and Depression: Significance in Diagnosing Myocardial Infarction
-
ST segment elevation: Suggests myocardial injury, often indicative of ST-elevation myocardial infarction (STEMI), a serious heart attack requiring immediate intervention. The elevation must meet specific criteria for diagnosis.
-
ST segment depression: May indicate myocardial ischemia (reduced blood flow to the heart muscle) or non-ST-elevation myocardial infarction (NSTEMI).
The QT Interval: Total Ventricular Activity
The QT interval represents the total time for ventricular depolarization and repolarization.
Normal Duration and Heart Rate Dependence
The normal QT interval duration varies depending on the heart rate. It is typically corrected for heart rate using formulas like Bazett’s formula (QTc).
Significance of Prolonged or Shortened QT Interval
-
Prolonged QT interval: Increases the risk of life-threatening ventricular arrhythmias, such as Torsades de Pointes. It can be caused by medications, electrolyte imbalances (hypokalemia, hypomagnesemia, hypocalcemia), congenital long QT syndrome, or acquired conditions.
-
Shortened QT interval: Can be seen in hypercalcemia, digoxin toxicity, or congenital short QT syndrome, which may also increase the risk of arrhythmias.
The P-R Segment: AV Nodal Delay
The P-R segment represents the time from the end of the P wave to the beginning of the QRS complex. It reflects the delay in the AV node, which allows the atria to contract and fill the ventricles before ventricular contraction occurs.
Normal Duration
The P-R segment is normally relatively short.
Significance of Abnormalities
While isolated abnormalities of the P-R segment are less commonly discussed, significant deviations, particularly in the context of other ECG changes, can suggest AV nodal dysfunction or conduction abnormalities. For instance, the segment is used to measure for AV blocks.
Having meticulously dissected the ECG waveform, assigning meaning to each undulation and interval, we can now leverage this knowledge to extract a vital clinical parameter: the heart rate. Accurately determining heart rate from an ECG is a fundamental skill, allowing clinicians to quickly assess a patient’s cardiac status and identify potential abnormalities. This section will delve into the methods for calculating heart rate from an ECG tracing and understanding the clinical significance of deviations from the normal range.
Heart Rate Demystified: Calculating Rate on an ECG
Heart rate, measured in beats per minute (BPM), is a crucial indicator of cardiac function. An ECG provides a visual representation of the heart’s electrical activity, allowing for accurate heart rate determination. Several methods exist for calculating heart rate from an ECG tracing, each with its own advantages and limitations.
Methods for Calculating Heart Rate
The 300, 150, 100, 75, 60, 50 Sequence Method
This is a rapid estimation method best suited for regular rhythms. Identify an R wave that falls on a bold line on the ECG paper. Then, note the heart rate values for each subsequent bold line: 300, 150, 100, 75, 60, 50.
The R wave’s position relative to these lines provides an approximate heart rate. This method is quick but less accurate for irregular rhythms.
The 1500 Method
This method is precise and also best used for regular rhythms. Count the number of small squares between two consecutive R waves (R-R interval).
Divide 1500 by that number to obtain the heart rate in BPM. (1500 represents the number of small squares in a minute, assuming a standard ECG paper speed of 25 mm/s).
The Six-Second Strip Method
This method is particularly useful for irregular rhythms. Count the number of QRS complexes in a six-second strip of the ECG tracing.
Multiply that number by 10 to estimate the heart rate in BPM. (ECG paper usually has markings indicating three-second intervals, making it easy to identify a six-second strip).
This provides an average heart rate over the measured period.
Using Calipers
For increased precision, especially in research settings, calipers can accurately measure the R-R interval. This measurement is then used in conjunction with the paper speed to calculate the heart rate.
Defining Bradycardia and Tachycardia
The normal resting heart rate for adults typically ranges from 60 to 100 BPM. Deviations from this range are classified as:
-
Bradycardia: A heart rate less than 60 BPM.
-
Tachycardia: A heart rate greater than 100 BPM.
It’s important to note that normal heart rate ranges can vary based on age, fitness level, and individual circumstances.
Clinical Implications of Abnormal Heart Rates
Abnormal heart rates can be indicative of various underlying conditions, impacting cardiac output and overall health.
Bradycardia: Clinical Significance
Slow heart rates may be normal in well-trained athletes due to increased vagal tone. However, in other individuals, bradycardia can be caused by:
- SA node dysfunction
- AV block
- Medications (e.g., beta-blockers)
- Hypothyroidism
Symptoms associated with bradycardia include fatigue, dizziness, lightheadedness, and syncope (fainting). Severe bradycardia can compromise cardiac output, leading to organ hypoperfusion.
Tachycardia: Clinical Significance
Elevated heart rates can result from:
- Physiological responses to exercise, stress, or anxiety
- Underlying medical conditions such as:
- Fever
- Anemia
- Hyperthyroidism
- Dehydration
Various arrhythmias, like supraventricular tachycardia (SVT) and ventricular tachycardia (VT), can also cause tachycardia. Prolonged or uncontrolled tachycardia can lead to:
- Reduced ventricular filling time
- Decreased cardiac output
- Myocardial ischemia (reduced blood flow to the heart muscle)
- Heart failure.
The clinical significance of abnormal heart rates underscores the importance of accurate ECG interpretation and prompt medical evaluation to identify and manage underlying causes.
Having meticulously dissected the ECG waveform, assigning meaning to each undulation and interval, we can now leverage this knowledge to extract a vital clinical parameter: the heart rate. Accurately determining heart rate from an ECG is a fundamental skill, allowing clinicians to quickly assess a patient’s cardiac status and identify potential abnormalities. This section will delve into the methods for calculating heart rate from an ECG tracing and understanding the clinical significance of deviations from the normal range.
Rhythm Recognition: Identifying Common Cardiac Arrhythmias
The human heart, a remarkable biological pump, typically beats with a consistent and predictable rhythm. However, various factors can disrupt this rhythm, leading to conditions known as cardiac arrhythmias. Arrhythmias are essentially irregularities in the heart’s electrical activity, resulting in heart rates that are too slow, too fast, or simply erratic.
Recognizing these arrhythmias on an ECG is a crucial skill for healthcare professionals, enabling prompt diagnosis and appropriate treatment. This section will introduce some common cardiac arrhythmias, providing visual examples and detailed explanations to enhance understanding.
Understanding Cardiac Arrhythmias
A cardiac arrhythmia, at its core, signifies a deviation from the heart’s normal rhythmic pattern. This disruption can stem from various causes, including:
-
Problems with the heart’s natural pacemaker (the sinoatrial node or SA node).
-
Interruptions or blockages in the heart’s electrical pathways.
-
Abnormal electrical activity originating from other parts of the heart.
The consequences of arrhythmias range from benign palpitations to life-threatening cardiac events.
Therefore, accurate identification and appropriate management are paramount.
Common Arrhythmias: A Closer Look
Let’s examine some of the most frequently encountered cardiac arrhythmias and their ECG characteristics:
Sinus Rhythm: The Baseline
Sinus rhythm represents the heart’s normal, healthy electrical activity. The SA node initiates the electrical impulse, which then travels through the atria, AV node, Bundle of His, and Purkinje fibers, resulting in a characteristic ECG pattern.
-
Key Features:
-
P waves are present and upright in lead II, preceding each QRS complex.
-
The PR interval is within the normal range (0.12-0.20 seconds).
-
The QRS complexes are narrow (typically less than 0.12 seconds).
-
The heart rate falls within the normal range (60-100 bpm).
-
Bradycardia: The Slow Beat
Bradycardia refers to a heart rate that is slower than normal, typically defined as below 60 beats per minute. While bradycardia can be normal in highly trained athletes, it can also indicate an underlying medical condition.
-
ECG Characteristics:
-
All the features of sinus rhythm are present.
-
The heart rate is less than 60 bpm.
-
-
Clinical Significance: Bradycardia may cause fatigue, dizziness, shortness of breath, or even syncope (fainting).
In some cases, it requires intervention, such as a pacemaker.
Tachycardia: The Rapid Beat
Tachycardia signifies a heart rate that is faster than normal, generally defined as above 100 beats per minute. Like bradycardia, tachycardia can be a normal response to exercise or stress, but it can also be a sign of an underlying problem.
-
ECG Characteristics: The specific ECG characteristics depend on the type of tachycardia.
-
Sinus tachycardia exhibits all the features of sinus rhythm, but the heart rate exceeds 100 bpm.
-
Other types of tachycardia, such as supraventricular tachycardia (SVT) or ventricular tachycardia (VT), display distinct ECG patterns that are beyond the scope of this introductory overview.
-
-
Clinical Significance: Tachycardia can cause palpitations, shortness of breath, chest pain, and lightheadedness.
Sustained tachycardia can be dangerous and may require immediate medical attention.
The ECG Machine and Electrode Placement: Ensuring Accurate Readings
Having gained a solid understanding of arrhythmia identification, the next critical aspect of ECG interpretation lies in appreciating the role of the electrocardiograph (ECG) machine itself and the meticulous process of electrode placement. These factors are foundational to acquiring accurate and reliable ECG readings. Faulty equipment or incorrect placement can lead to misdiagnosis and potentially harmful treatment decisions.
Understanding the Electrocardiograph
The electrocardiograph, commonly known as the ECG machine, is a sophisticated electronic device that detects, amplifies, and records the electrical activity of the heart over a period of time.
It translates the heart’s electrical signals into a visual representation, the ECG tracing, which we’ve been dissecting in previous sections.
Modern ECG machines are often computerized, offering features like automated interpretation assistance, digital storage, and seamless integration with electronic health records.
However, it’s crucial to remember that these automated interpretations are only aids and should always be confirmed by a qualified healthcare professional. The machine’s accuracy relies entirely on the quality of the input signal.
The Significance of Correct Electrode Placement
Accurate ECG interpretation hinges on the precise placement of electrodes on the patient’s body. Electrodes are conductive pads that are attached to the skin to detect the electrical signals emanating from the heart. The standard 12-lead ECG requires 10 electrodes:
- Four limb electrodes.
- Six chest electrodes.
The position of each electrode is specifically defined to capture the heart’s electrical activity from different angles, providing a comprehensive view of its function. Deviation from these standard positions can significantly alter the ECG waveform and lead to misinterpretations.
Limb Lead Placement: Einthoven’s Triangle and Beyond
The limb leads provide information about the heart’s electrical activity in the frontal plane. These leads are derived from electrodes placed on the:
- Right arm (RA).
- Left arm (LA).
- Right leg (RL).
- Left leg (LL).
Einthoven’s Triangle
The first three limb leads (I, II, and III) form what’s known as Einthoven’s Triangle, an equilateral triangle with the heart at its center.
- Lead I records the potential difference between the left arm (LA) and the right arm (RA) (LA – RA).
- Lead II records the potential difference between the left leg (LL) and the right arm (RA) (LL – RA).
- Lead III records the potential difference between the left leg (LL) and the left arm (LA) (LL – LA).
Augmented Limb Leads: Goldberger Leads
The augmented limb leads (aVR, aVL, and aVF) provide additional information about the frontal plane.
- aVR records the potential at the right arm (RA) relative to the average of the left arm (LA) and left leg (LL).
- aVL records the potential at the left arm (LA) relative to the average of the right arm (RA) and left leg (LL).
- aVF records the potential at the left leg (LL) relative to the average of the right arm (RA) and left arm (LA).
It’s essential to place the limb electrodes on the limbs themselves (wrists and ankles) and not on the torso, to ensure consistent and accurate readings.
Chest Lead Placement: The Precordial View
The chest leads, also known as precordial leads (V1-V6), provide information about the heart’s electrical activity in the horizontal plane. They are placed on the chest in specific locations:
- V1: Fourth intercostal space, right sternal border.
- V2: Fourth intercostal space, left sternal border.
- V3: Midway between V2 and V4.
- V4: Fifth intercostal space, midclavicular line.
- V5: Fifth intercostal space, anterior axillary line.
- V6: Fifth intercostal space, mid-axillary line.
The correct placement of the chest leads is particularly critical for diagnosing certain cardiac conditions, such as myocardial infarction (heart attack). Even a small deviation can significantly alter the ST-segment elevation, potentially leading to a false-positive or false-negative diagnosis.
Avoiding Common Electrode Placement Errors
Several common errors can occur during electrode placement, leading to inaccurate ECG recordings. These include:
- Reversal of limb leads: This can result in significant waveform abnormalities and misdiagnosis.
- Incorrect placement of chest leads: As mentioned earlier, this can affect the ST segment and other waveform characteristics.
- Poor skin preparation: The skin should be clean and dry to ensure good electrode contact. Hair may need to be shaved.
- Loose or detached electrodes: This can cause artifact and interfere with the ECG signal.
The Impact of Proper Electrode Placement on Diagnosis
The importance of proper electrode placement cannot be overstated. Accurate ECG readings are essential for:
- Detecting arrhythmias.
- Diagnosing myocardial infarction.
- Identifying electrolyte imbalances.
- Monitoring the effects of medications.
By ensuring correct electrode placement, healthcare professionals can obtain reliable ECG data and make informed clinical decisions, ultimately improving patient outcomes.
ECGs in Acute Myocardial Infarction: Spotting the Signs of a Heart Attack
With a firm grasp of ECG fundamentals and the factors that influence reading accuracy, we can now turn our attention to one of the most critical applications of ECGs: the diagnosis of acute myocardial infarction (MI), commonly known as a heart attack.
The ECG as a Lifeline in MI Diagnosis
The electrocardiogram serves as an indispensable tool in the rapid diagnosis and management of myocardial infarction. In cases of suspected heart attack, time is muscle. The ECG provides a real-time snapshot of the heart’s electrical activity, allowing clinicians to quickly identify patterns indicative of myocardial ischemia (reduced blood flow) and injury.
This rapid assessment is crucial because early intervention, such as thrombolysis (clot-dissolving medication) or percutaneous coronary intervention (PCI, angioplasty), can significantly reduce myocardial damage and improve patient outcomes. The ECG’s ability to differentiate between different types of MI directly influences treatment strategies.
ECG Changes in the Evolution of Myocardial Infarction
Myocardial infarction doesn’t present as a singular event on an ECG; rather, it unfolds through a series of characteristic changes that reflect the evolving state of the heart muscle. Recognizing these changes at different stages is paramount for accurate diagnosis and timely intervention.
Hyperacute T Waves
In the very early stages of MI, sometimes within minutes of symptom onset, the ECG may display hyperacute T waves. These are tall, broad, and often asymmetrical T waves, particularly prominent in the leads facing the affected area of the heart. While often transient, their presence should raise a high index of suspicion for acute ischemia.
ST-Segment Elevation: The Hallmark of STEMI
ST-segment elevation is arguably the most critical ECG finding in acute MI, particularly in the context of STEMI (ST-elevation myocardial infarction). This elevation signifies transmural ischemia, meaning the ischemia affects the full thickness of the heart muscle.
The degree of ST elevation is typically measured at the J-point (the junction between the end of the QRS complex and the beginning of the ST segment). Specific criteria for ST-segment elevation vary slightly depending on the lead, but generally, elevation of ≥1 mm in two contiguous limb leads or ≥2 mm in two contiguous precordial leads is considered significant.
Q Wave Formation
As myocardial infarction progresses, pathologic Q waves may develop. These are wider (≥0.04 seconds) and deeper (≥25% of the R wave amplitude) than normal Q waves. Pathologic Q waves typically indicate that irreversible myocardial damage has occurred and represent electrical silence in the infarcted area.
T-Wave Inversion
Following ST-segment elevation, the T waves may invert, often symmetrically. T-wave inversion in the leads facing the infarct area usually signifies ischemia and injury. The presence and evolution of T-wave inversions provide valuable information about the age and extent of the infarction.
ST-Segment Elevation Myocardial Infarction (STEMI): A Critical Distinction
The identification of ST-segment elevation is crucial as it defines STEMI, a type of heart attack that requires immediate reperfusion therapy (restoration of blood flow). Rapid recognition of STEMI on the ECG is essential to activate the appropriate treatment pathways, whether it be emergent PCI or thrombolytic therapy.
ECG changes can be subtle, and relying solely on automated interpretations is insufficient. Experienced clinicians must meticulously evaluate the ECG in conjunction with the patient’s clinical presentation to ensure accurate and timely diagnosis and treatment.
ECG Waves Explained: FAQs
This section answers common questions about understanding ECG waves and interpreting ECG readings based on our guide.
What do the different ECG waves actually represent?
Each wave on an ECG tracing corresponds to a specific electrical event in the heart. The P wave represents atrial depolarization, the QRS complex represents ventricular depolarization, and the T wave represents ventricular repolarization. Understanding this relationship is key to ecg waves explanation.
How can I tell if an ECG reading is normal?
A normal ECG reading shows consistent timing and shapes of the P wave, QRS complex, and T wave. Deviation from these typical patterns, in terms of duration, amplitude, or morphology, may indicate a cardiac abnormality. Proper ecg waves explanation also relies on heart rate assessment.
What are some common conditions that can affect ECG waves?
Many conditions can alter ECG waves, including heart attack, arrhythmias, electrolyte imbalances, and certain medications. These changes manifest differently on the ECG, requiring careful analysis of the ecg waves explanation and context.
Why is understanding ECG waves so important?
Understanding ECG waves is crucial for diagnosing and monitoring heart conditions. It allows healthcare professionals to identify abnormalities in heart rhythm and electrical activity, leading to timely interventions and improved patient outcomes. It’s a fundamental aspect of ecg waves explanation in clinical practice.
Alright, that wraps up our deep dive into ecg waves explanation! Hopefully, you now have a much clearer understanding of how to read and interpret those squiggly lines. Go forth and diagnose… carefully, of course! Thanks for sticking around.