Isoline maps, visualizations showing lines connecting points of equal value, find broad application in fields like meteorology, where weather patterns are depicted using isotherms (lines of equal temperature). Geographic Information Systems (GIS) software often provides robust tools for creating and analyzing these maps, with packages like QGIS offering functionalities for interpolation and contour generation. A fundamental question that often arises when considering these applications is: how do we define isoline map with sufficient accuracy and interpretability for diverse geographical datasets?
In an era dominated by data, the ability to effectively visualize and interpret complex information is paramount. Data visualization transforms raw figures into accessible insights, enabling informed decision-making across diverse fields. From tracking market trends to understanding climate change, visual representations of data are indispensable tools for comprehension and communication.
Why Data Visualization Matters
Data visualization is more than just creating pretty charts; it’s about revealing the underlying patterns and relationships within data. Effective visualizations can highlight anomalies, identify trends, and communicate complex ideas in a clear and concise manner. This is particularly crucial when dealing with large datasets, where traditional analytical methods may fall short.
The Intriguing World of Isoline Maps
Imagine looking at a weather forecast and instantly understanding temperature variations across a region. Or visualizing pollution levels spreading from an industrial site. This intuitive understanding is made possible by isoline maps.
Isoline maps use lines to connect points of equal value, creating a visual representation of continuous data. For example, weather forecasts commonly use isotherms, which are isolines that connect points of equal temperature. Similarly, isobars depict areas of equal atmospheric pressure, crucial for predicting weather patterns. These maps transform abstract numerical data into easily understandable visual representations, revealing spatial patterns and trends at a glance.
Defining Isoline Maps: A Visual Language
An isoline map is a type of thematic map that uses lines to connect points of equal value. These lines, known as isolines, represent a specific quantity that varies continuously over an area. This contrasts with other types of maps that might represent discrete data, such as the location of cities or roads.
The purpose of this article is to provide an accessible guide to mastering the art of reading and understanding isoline maps. By demystifying the concepts and techniques involved, we aim to empower readers to effectively utilize isoline maps in their respective fields, unlocking their potential for data analysis and informed decision-making. We’ll explore the fundamental principles, practical applications, and step-by-step methods for interpreting these powerful visualization tools.
Defining Isoline Maps: The Basics
Isoline maps offer a powerful visual language for representing continuous data. But what exactly is an isoline map, and how do they function? Let’s delve into the fundamental concepts that underpin these informative visualizations.
What is an Isoline Map?
An isoline map is a thematic map that employs lines to connect points of equal value. It’s a visual representation of a continuous phenomenon, meaning a phenomenon that exists and varies across an area.
Think of temperature, elevation, or air pressure – these are all examples of continuous data.
The essence of an isoline map lies in its ability to transform abstract numerical information into an easily digestible visual format. By drawing lines that link locations with identical values, the map reveals spatial patterns and trends that might otherwise remain hidden within raw data.
Understanding Contour Lines: A Key Element
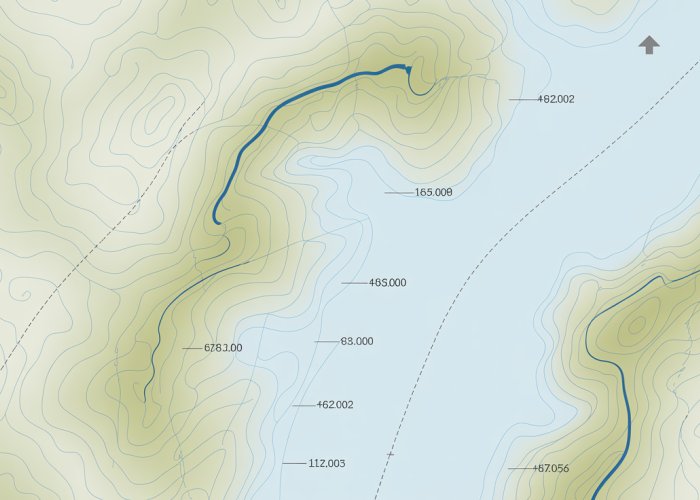
Within the broader family of isoline maps resides a particularly important type: the contour line map. Contour lines are isolines that specifically represent elevation.
These lines connect points of equal altitude above a given datum, typically mean sea level.
Contour lines are a staple of topographic maps, providing a crucial means of visualizing the shape and form of the land. By examining the spacing and arrangement of contour lines, one can infer the steepness of slopes, identify valleys and ridges, and understand the overall terrain.
A closer spacing indicates a steeper slope, while wider spacing means a gentler slope.
The Role of Gradient
The concept of gradient is inherently linked to isoline maps. Gradient refers to the rate of change of a quantity. In the context of an isoline map, it describes how rapidly the value being represented changes across the map.
The gradient is always perpendicular to the isolines. This means that the steepest change occurs in the direction perpendicular to the lines.
Closely spaced isolines indicate a steep gradient. This implies a rapid change in the value being mapped. Conversely, widely spaced isolines signify a gentle gradient, indicating a gradual change.
Examples of Isoline Maps: Isotherm and Isobar
To further solidify the understanding of isoline maps, let’s consider two common examples: isotherms and isobars.
Isotherms are isolines that connect points of equal temperature. These are commonly seen on weather maps. They provide a visual representation of temperature variations across a region.
By examining the pattern of isotherms, one can easily identify areas of warm and cold air.
Isobars are isolines that connect points of equal atmospheric pressure. These are essential for weather forecasting. They help predict the movement of weather systems and the likelihood of precipitation.
Areas with tightly packed isobars indicate strong pressure gradients, which often translate to windy conditions.
Isotherm and isobar maps showcase how isolines can be used to represent different types of continuous data, each providing valuable insights into the phenomena they depict. Understanding these common examples lays a solid foundation for interpreting other types of isoline maps.
The concept of gradient helps us understand how quickly a value changes across a given area. But to truly appreciate the utility of isoline maps, it’s crucial to see them in action. Let’s explore some real-world examples where these maps provide invaluable insights.
Isoline Maps in Action: Real-World Applications
Isoline maps aren’t just theoretical constructs; they are powerful tools used across a wide range of disciplines. From visualizing the peaks and valleys of a mountain range to understanding the spread of pollutants, isoline maps offer a clear and concise way to represent complex spatial data. Let’s delve into some specific examples, starting with their ubiquitous role in topographic mapping.
Topographic Maps and Elevation: Visualizing the Landscape
Perhaps the most recognizable application of isoline maps is in topographic maps, where contour lines are used to represent elevation. These maps are essential for hikers, surveyors, engineers, and anyone who needs to understand the shape and form of the land.
Interpreting Contour Intervals
Contour interval refers to the vertical distance between adjacent contour lines. A smaller contour interval provides a more detailed representation of the terrain, while a larger interval simplifies the map and highlights major elevation changes. The choice of contour interval depends on the scale of the map and the nature of the terrain being depicted.
For example, a map of a relatively flat area might use a contour interval of 5 or 10 feet, while a map of mountainous terrain might use an interval of 50 or 100 feet.
Understanding Terrain Features
By carefully examining the spacing and arrangement of contour lines, one can glean a wealth of information about the underlying terrain. Closely spaced contour lines indicate a steep slope, while widely spaced lines suggest a gentle slope.
Concentric closed contours typically represent hills or mountains, with the innermost contour indicating the summit. Depressions, such as valleys or sinkholes, are often indicated by closed contours with hachure marks (short lines pointing inward).
Beyond Geography: Applications in Other Fields
While topographic maps are perhaps the most familiar application of isoline maps, their utility extends far beyond the realm of geography. The underlying principle of connecting points of equal value can be applied to any continuous phenomenon.
Population Density Maps
Isoline maps can be used to visualize population density, with isolines connecting areas of equal population per unit area. These maps can reveal patterns of population distribution and identify areas of high or low density.
Pollution Level Maps
Isopleths (a general term for isolines representing any kind of quantity) can be used to map pollution levels, showing the concentration of pollutants in the air, water, or soil. These maps are crucial for environmental monitoring and remediation efforts. They help identify pollution hotspots and track the movement of pollutants over time.
Temperature and Weather Patterns
As mentioned earlier, isotherms (lines of equal temperature) are a staple of weather maps, providing a visual representation of temperature gradients across a region. Isobars (lines of equal pressure) are similarly used to map atmospheric pressure, helping meteorologists predict weather patterns.
In short, isoline maps serve as a versatile tool for representing and interpreting spatial data in numerous fields. They transform raw data into visually accessible information, facilitating a deeper understanding of the world around us.
Isoline maps provide immense value in visualizing data, but they don’t magically appear. Constructing accurate and informative isoline maps requires careful consideration of data quality, appropriate techniques for estimating values between known data points, and the right tools to bring it all together. This section serves as a practical guide to the creation of isoline maps, exploring the essential elements that underpin their accuracy and effectiveness.
Creating Isoline Maps: A Practical Guide
Creating isoline maps is a process that blends science and art. It requires a strong foundation in data collection and analysis. Furthermore, an understanding of cartographic principles and the use of specialized software is also needed.
The Importance of Data and Interpolation
The foundation of any reliable isoline map is the quality of its underlying data. The more accurate and representative your data, the more faithfully your map will reflect the true patterns and trends.
Accurate data collection is paramount. This often involves meticulous field measurements, reliable sensor readings, or careful compilation of existing datasets. The density of data points is also crucial. A higher density generally leads to a more detailed and accurate map, especially in areas with complex variations.
Understanding Interpolation Techniques
However, real-world data is rarely comprehensive. We often have measurements only at specific locations, and need to estimate values between those points. This is where interpolation comes in.
Interpolation techniques are used to estimate values at unsampled locations based on the known values of surrounding data points. Several methods exist, each with its own strengths and weaknesses. Common techniques include:
-
Inverse Distance Weighting (IDW): This method assumes that the value at an unknown point is more influenced by closer points than by more distant ones. The value is calculated as a weighted average of the values at known points, with the weights inversely proportional to the distance from the unknown point.
-
Kriging: A more advanced geostatistical technique that takes into account the spatial correlation of the data. Kriging attempts to minimize the variance of the estimation errors. It requires a more sophisticated understanding of spatial statistics but can produce more accurate results, especially when dealing with spatially autocorrelated data.
-
Spline Interpolation: This method fits a smooth curve through the known data points. It’s useful for creating visually appealing maps but may not be as accurate as other methods if the data is noisy or has abrupt changes.
The choice of interpolation method depends on the characteristics of the data, the desired accuracy, and the computational resources available. Understanding the assumptions and limitations of each technique is essential for producing meaningful isoline maps.
Cartography: The Art and Science of Map Making
Cartography is more than just drawing lines on a map. It is the art and science of visually representing spatial data. It involves making conscious decisions about map design. This includes choices about color schemes, symbolization, labeling, and overall layout.
Effective cartography ensures that the map communicates information clearly, accurately, and aesthetically. Considerations such as color choices, font sizes, and the placement of labels can all influence how easily a viewer can understand the map. A well-designed map should be intuitive and easy to interpret, allowing the reader to quickly grasp the key patterns and trends.
GIS (Geographic Information System) and Software: Tools of the Trade
Creating isoline maps by hand is a tedious and time-consuming process. Fortunately, Geographic Information System (GIS) software provides powerful tools for automating the process. GIS software allows users to:
- Import and manage spatial data.
- Perform interpolation.
- Generate isolines.
- Customize map elements.
Popular GIS Software Options
Several GIS software packages are available, each with its own set of features, capabilities, and price points. Some popular options include:
-
ArcGIS: A comprehensive and widely used GIS software suite developed by Esri. ArcGIS offers a broad range of tools for spatial analysis, mapping, and data management. It is considered an industry standard.
-
QGIS: A free and open-source GIS software package that provides a powerful alternative to commercial options. QGIS offers a wide range of functionalities and is supported by a large and active community.
-
Other Options: Other GIS software options exist, such as GRASS GIS, GeoDa, and MapInfo Pro.
Regardless of the chosen software, familiarity with GIS concepts and techniques is crucial for creating high-quality isoline maps. GIS software empowers users to efficiently process large datasets, experiment with different interpolation methods, and produce visually appealing and informative maps.
Isoline maps provide immense value in visualizing data, but they don’t magically appear. Constructing accurate and informative isoline maps requires careful consideration of data quality, appropriate techniques for estimating values between known data points, and the right tools to bring it all together. This section serves as a practical guide to the creation of isoline maps, exploring the essential elements that underpin their accuracy and effectiveness.
With a well-constructed isoline map in hand, the task shifts from creation to interpretation. Extracting meaningful insights from these visual representations requires a systematic approach, and understanding of potential pitfalls, and a keen eye for detail.
Interpreting Isoline Maps: A Step-by-Step Approach
Interpreting isoline maps is not merely about glancing at the lines.
It’s a process of carefully extracting information and understanding the patterns they reveal.
This section provides a structured approach to analyzing isoline maps, enabling you to confidently decipher their message.
Analyzing Patterns and Trends
The primary goal of interpreting an isoline map is to identify significant patterns and trends within the data.
This involves recognizing areas of high and low values and understanding how the rate of change varies across the map.
Identifying High and Low Values
The first step in analyzing an isoline map is to identify areas of high and low concentration.
Closed isolines often indicate peaks or depressions. A set of concentric isolines with values increasing inwards typically signifies a peak or a high point, depending on the phenomenon represented. Conversely, concentric isolines with values decreasing inwards usually indicate a depression or a low point.
These areas represent significant deviations from the average and can be key indicators of underlying phenomena.
Interpreting Isoline Spacing and Rate of Change
The spacing between isolines provides crucial information about the rate of change of the variable being mapped.
Closely spaced isolines indicate a rapid change in value over a short distance, signifying a steep gradient or a strong rate of change. For example, on a topographic map, closely spaced contour lines represent a steep slope.
Conversely, widely spaced isolines indicate a gradual change in value, representing a gentle slope or a slow rate of change.
Understanding the relationship between isoline spacing and rate of change is essential for accurately interpreting the map.
Avoiding Common Misinterpretations
While isoline maps are powerful tools, they are not without their potential for misinterpretation.
It’s important to be aware of common pitfalls to ensure accurate analysis.
Recognizing Potential Pitfalls
One common mistake is assuming a linear change between isolines. Interpolation methods estimate values, but the actual change may be more complex.
Another pitfall is over-interpreting data in areas with sparse data points. Isoline maps are only as good as the underlying data; areas with limited data may have less accurate isolines.
Finally, be mindful of the scale of the map.
A small-scale map may generalize patterns and obscure local variations.
Emphasizing Data Understanding
The most crucial aspect of interpreting isoline maps is a thorough understanding of the data being represented.
What variable is being mapped?
What are the units of measurement?
What is the data’s source and accuracy?
Without this context, it’s easy to draw incorrect conclusions from the map.
For instance, a map of population density might be misinterpreted as a map of total population if the reader doesn’t understand the difference between these two variables.
Always consider the underlying data and its limitations when interpreting isoline maps.
Isoline Maps: Frequently Asked Questions
Here are some common questions about isoline maps to help you master their use and understanding.
What exactly is an isoline map?
An isoline map is a type of map that uses lines to connect points of equal value. These lines, called isolines, show the distribution of a particular phenomenon, helping you visualize patterns and trends. Essentially, we define isoline map by its purpose: to show continuous data variations.
What are some common examples of isoline maps?
You’ve probably seen isoline maps depicting weather patterns! Common examples include contour maps (elevation), isotherm maps (temperature), isobar maps (atmospheric pressure), and isohyet maps (rainfall). All these use isolines to define isoline map representation in geography.
How do you read and interpret an isoline map?
The closer the isolines are together, the steeper the change in value. Widely spaced isolines indicate a gradual change. Note the values associated with each isoline to understand the magnitude of the mapped phenomenon; therefore, interpret data define isoline map’s meaning.
What are the advantages of using isoline maps?
Isoline maps provide a clear visual representation of continuous data distributions, making it easy to identify patterns and trends that might be difficult to see in raw data. They’re effective for visualizing spatial relationships and helping to define isoline map usage.
So, now you’ve got the hang of it! Go ahead and experiment with creating your own isoline maps. Hopefully, you have a better understanding of how we define isoline map.