The mechanical behavior of copper, a crucial metal in applications ranging from electrical wiring to plumbing, is fundamentally described by its stress-strain curve. Understanding this curve allows engineers to predict how copper will deform under load, crucial knowledge for ensuring structural integrity. Finite Element Analysis (FEA), a powerful computational tool, relies heavily on accurate stress-strain data for copper alloys. Material scientists at institutions like the American Society for Testing and Materials (ASTM), contribute to the development of standardized testing procedures that generate this vital data. These procedures often involve equipment like the Instron Universal Testing Machine, used to precisely measure the force and elongation of copper specimens to produce the copper stress-strain curve.
Copper, a reddish-gold metal, stands as one of humanity’s most enduring and indispensable materials. From ancient tools and ornaments to modern electronics and infrastructure, copper’s versatility has shaped civilizations. Its unique combination of properties – high electrical and thermal conductivity, corrosion resistance, and malleability – makes it a cornerstone of countless engineering applications.
Copper: The Ubiquitous Engineering Material
Consider the vast electrical grids powering our cities, the intricate wiring within our devices, and the plumbing systems ensuring clean water delivery. In all these critical systems, copper plays a vital role. Its ability to efficiently conduct electricity makes it indispensable in power transmission and electronics. Its resistance to corrosion ensures longevity in plumbing and marine applications.
The Significance of the Stress-Strain Curve
Understanding how copper behaves under stress is paramount for engineers and designers. This is where the stress-strain curve becomes invaluable. The stress-strain curve is a graphical representation of a material’s response to applied forces, charting the relationship between stress (force per unit area) and strain (deformation). This curve provides a wealth of information about the material’s mechanical properties, including its elasticity, strength, and ductility.
By analyzing the stress-strain curve, engineers can predict how copper will behave under different loading conditions, optimizing designs for safety and performance. The stress-strain curve can also serve as a valuable tool for failure analysis.
Demystifying the Copper Stress-Strain Curve
This article aims to demystify the copper stress-strain curve, breaking down its key parameters and revealing their practical implications. We will explore the different regions of the curve, from the initial elastic region to the point of ultimate failure, explaining the underlying material behavior at each stage.
By understanding the information contained within the copper stress-strain curve, engineers, scientists, and anyone working with this essential metal can unlock its full potential and ensure its reliable performance in a wide range of applications. Our goal is to provide a clear and accessible guide to this critical tool in materials science.
Copper’s mechanical behavior, as revealed through its stress-strain curve, provides invaluable insights for engineers and designers. However, to truly unlock the secrets held within this curve, we must first establish a solid understanding of the fundamental concepts that underpin it: stress and strain. These two interconnected quantities form the very basis for interpreting a material’s response to applied forces.
Stress and Strain: The Foundational Concepts
Understanding stress and strain is paramount when working with any material, especially in engineering applications. They are the foundation upon which the entire concept of the stress-strain curve is built. Let’s delve into each concept individually before examining their crucial relationship.
Defining Stress: Force Within the Material
Stress is defined as the force acting per unit area within a material that is subjected to an external load. Imagine pulling on a copper wire; the internal forces resisting that pull are distributed across the wire’s cross-sectional area. This internal resistance, quantified as force per area, is what we call stress.
Mathematically, stress (often denoted by the Greek letter sigma, σ) is expressed as:
σ = F/A
Where:
- σ represents the stress.
- F is the applied force.
- A is the cross-sectional area over which the force acts.
It’s crucial to understand that stress is an internal measure of the forces that atoms and molecules within a continuous material exert on each other, while strain is a measure of the deformation of the material.
Types of Stress
Stress can manifest in different forms depending on the direction of the applied force relative to the surface area. The primary types of stress are:
-
Tensile Stress: Occurs when a material is pulled or stretched, resulting in elongation. Think of pulling on a rubber band.
-
Compressive Stress: Arises when a material is pushed or compressed, leading to shortening. Imagine stacking books on top of each other.
-
Shear Stress: Occurs when a force is applied parallel to a surface, causing one part of the material to slide relative to another. Think of cutting paper with scissors.
Each type of stress induces a corresponding type of strain.
Defining Strain: Measuring Deformation
Strain quantifies the deformation of a material in response to applied stress. In simpler terms, it’s a measure of how much a material changes shape or size when subjected to a force. Strain is a dimensionless quantity, often expressed as a ratio or percentage, as it represents the change in length divided by the original length.
Mathematically, strain (often denoted by the Greek letter epsilon, ε) is expressed as:
ε = ΔL/L₀
Where:
- ε represents the strain.
- ΔL is the change in length.
- L₀ is the original length.
Types of Strain
Similar to stress, strain also comes in different forms, corresponding to the type of stress applied:
-
Tensile Strain: Occurs when a material is stretched, resulting in an increase in length.
-
Compressive Strain: Occurs when a material is compressed, resulting in a decrease in length.
-
Shear Strain: Represents the change in angle resulting from shear stress. It’s the tangent of the angle of deformation.
The Interconnected Relationship: Stress and Strain in Materials Science
Stress and strain are inextricably linked. Stress is the cause, and strain is the effect. The relationship between stress and strain is fundamental to understanding a material’s mechanical behavior. This relationship is graphically represented by the stress-strain curve.
This relationship is crucial in:
- Materials Selection: Choosing the right material for a specific application requires understanding how it will respond to stress.
- Structural Design: Engineers use stress-strain relationships to design safe and reliable structures.
- Failure Analysis: Understanding stress and strain helps determine the cause of material failures.
In both Materials Science and Mechanical Engineering, a deep understanding of stress and strain is not merely theoretical; it is an essential tool for designing, analyzing, and predicting the behavior of materials and structures in the real world. By grasping these fundamental concepts, we can begin to interpret the information provided by the copper stress-strain curve and apply it to practical engineering challenges.
Stress and strain, while fundamental in their own right, truly shine when viewed in tandem. Their relationship, plotted graphically, forms the stress-strain curve – a fingerprint of a material’s mechanical behavior. For copper, this curve offers a wealth of information, enabling engineers to predict its response under load and design accordingly. Let’s now embark on a journey through the key regions and characteristics that define a typical copper stress-strain curve, revealing the material’s secrets at each stage.
Deconstructing the Copper Stress-Strain Curve: A Comprehensive Analysis
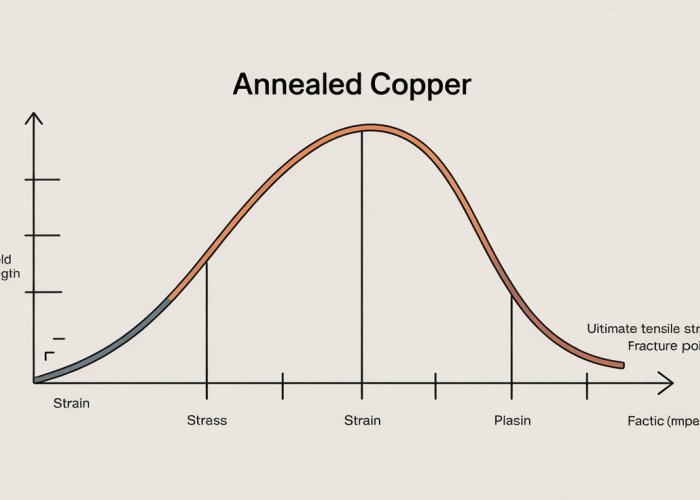
The stress-strain curve for copper, like that of many ductile metals, exhibits distinct regions that correspond to different deformation mechanisms. It’s a graphical representation of how copper responds to applied forces, charting the relationship between stress (force per unit area) and strain (deformation). Understanding this curve is critical for predicting how copper will behave in various engineering applications.
The Initial Linear Region: Elastic Deformation
The initial portion of the copper stress-strain curve is typically linear. This region represents elastic deformation, where the material deforms reversibly. Imagine stretching a rubber band; it returns to its original shape once you release it. Similarly, within the elastic region, copper will return to its original dimensions upon removal of the applied load.
This elastic behavior arises from the stretching of atomic bonds within the crystal structure of the copper. The atoms are displaced from their equilibrium positions, but they return to those positions when the stress is removed.
Young’s Modulus (E): A Measure of Stiffness
The slope of this linear region is known as Young’s Modulus (E), also referred to as the modulus of elasticity. It represents the stiffness of the material, indicating its resistance to elastic deformation. A higher Young’s Modulus implies a stiffer material, requiring more stress to achieve a given amount of elastic strain.
Hooke’s Law: Governing Elastic Behavior
The elastic behavior of copper in this region is governed by Hooke’s Law, which states that stress is directly proportional to strain. Mathematically, this is expressed as:
σ = Eε
Where:
σ is the stress.
E is Young’s Modulus.
ε is the strain.
This relationship holds true only within the elastic limit.
Beyond the Limit: Plastic Deformation
As the applied stress exceeds a certain threshold, the copper enters the plastic deformation region. Unlike elastic deformation, plastic deformation is permanent; the material will not return to its original dimensions upon removal of the load. This is akin to bending a paperclip; it retains its new shape.
At the atomic level, plastic deformation involves the movement of dislocations, which are imperfections within the crystal lattice. These dislocations allow atoms to slide past each other, resulting in permanent changes in the material’s shape.
Yield Strength: The Onset of Plasticity
The point at which the curve deviates from its linear elastic behavior and enters the plastic region is known as the yield strength. This value represents the stress required to initiate plastic deformation in the copper. It’s a crucial parameter for design engineers, as exceeding the yield strength can lead to permanent deformation and potential failure of the component.
Work Hardening (Strain Hardening): Strengthening Through Deformation
Following the yield point, the copper enters a region where the stress required to continue plastic deformation increases. This phenomenon is known as work hardening or strain hardening.
As the copper is plastically deformed, the density of dislocations increases. These dislocations impede each other’s movement, making it more difficult to further deform the material. Consequently, the copper becomes stronger and harder.
This strengthening effect is utilized in various manufacturing processes, such as cold rolling and drawing, to enhance the mechanical properties of copper components.
Reaching the Peak: Tensile Strength
As plastic deformation continues, the stress eventually reaches a maximum value. This point on the stress-strain curve represents the tensile strength of the copper. The tensile strength indicates the maximum stress that the material can withstand before it begins to neck.
Necking is a localized reduction in cross-sectional area that occurs under tensile loading. It signals the onset of instability and impending failure.
The Final Stage: Necking and Fracture
Beyond the tensile strength, the stress-strain curve begins to decline. This is due to the necking phenomenon, where the localized reduction in area leads to a concentration of stress in that region.
The reduced area can no longer support the applied load, and the material begins to fail. Eventually, the copper will fracture, marking the end of the stress-strain curve. The point at which fracture occurs is known as the fracture strength. The shape of the curve, particularly after the tensile strength, can provide insights into the ductility of the copper, indicating how much plastic deformation it can withstand before failure.
Stress and strain, while fundamental in their own right, truly shine when viewed in tandem. Their relationship, plotted graphically, forms the stress-strain curve – a fingerprint of a material’s mechanical behavior. For copper, this curve offers a wealth of information, enabling engineers to predict its response under load and design accordingly. Let’s now embark on a journey through the key regions and characteristics that define a typical copper stress-strain curve, revealing the material’s secrets at each stage.
Key Mechanical Properties Unveiled: What the Stress-Strain Curve Tells Us
The stress-strain curve is far more than just a pretty graph; it’s a treasure trove of vital mechanical properties. These properties, extracted from the curve, dictate how copper behaves under stress and are indispensable for informed engineering design. Let’s examine how Young’s modulus, yield strength, tensile strength, and ductility – all revealed by the stress-strain curve – influence real-world applications.
Young’s Modulus (E): Gauging Elasticity
Young’s Modulus, often denoted as E, is the embodiment of a material’s stiffness within its elastic region. Numerically, it’s the slope of the initial linear portion of the stress-strain curve.
A high Young’s modulus signifies that the material is rigid and resists deformation. Copper’s Young’s modulus is critical in applications where minimal deformation is desired under load.
For example, in electrical connectors, a high E ensures a tight, reliable connection that won’t loosen due to bending or stretching. This precise prediction of elastic behavior is vital for structural integrity.
Yield Strength: Avoiding Permanent Deformation
Yield strength marks the point where the material transitions from elastic to plastic deformation. Beyond this point, the deformation becomes permanent; the material will not return to its original dimensions upon removal of the load.
This property is crucial in design because exceeding the yield strength can lead to component failure. Engineers use yield strength to ensure that copper components operate within their elastic limits under normal operating conditions.
This is especially important in applications like copper pipes or tubing, where permanent deformation could lead to leaks or structural compromise. Knowing the yield strength provides a safety margin against such failures.
Tensile Strength: Load-Bearing Capacity
Tensile strength represents the maximum stress a material can endure before it begins to neck down. Necking is the localized reduction in cross-sectional area that precedes fracture.
Although a material can withstand stress beyond the yield point, the tensile strength is the absolute upper limit of stress it can bear. Tensile strength is paramount for assessing a material’s load-bearing capacity.
Applications such as copper wiring in high-tension power lines depend on the tensile strength to avoid snapping under mechanical stress. Designers rely on this value to ensure structural safety.
Ductility: Measuring Malleability
Ductility is a measure of a material’s ability to undergo plastic deformation before fracture. It is often quantified as percent elongation or reduction in area.
A highly ductile material can be drawn into wires or hammered into sheets without breaking. The stress-strain curve reveals ductility by showing the extent of the plastic region.
Copper’s high ductility is the reason it’s used extensively in wiring; it can be drawn into fine wires without losing its structural integrity. Ductility dictates how well a material can be shaped or formed.
The Role of ASTM Standards
The American Society for Testing and Materials (ASTM) sets the gold standard for material testing procedures. ASTM standards ensure uniformity and accuracy in determining material properties like those derived from the stress-strain curve.
Adhering to these standards means that tensile tests are conducted using precisely defined procedures, equipment, and specimen geometries. This is vital for consistency.
The benefit of using ASTM standards is that material properties are determined accurately and reliably. This ensures that engineers worldwide can use the same data with confidence. Standardized testing provides trust in the data.
Key mechanical properties gleaned from the stress-strain curve, like Young’s modulus, yield strength, tensile strength, and ductility, provide invaluable insights for design and engineering. But how are these curves actually generated in the first place? The answer lies in carefully controlled experimentation, bringing us to the practical realm of material testing.
Experiment in Action: Determining the Copper Stress-Strain Curve
The theoretical understanding of copper’s behavior is powerfully complemented by experimental validation. Obtaining a reliable stress-strain curve for copper requires a meticulous experimental setup. This involves employing specialized equipment, precise data acquisition, and careful consideration of factors that can affect the test results. This section explores the process of generating a copper stress-strain curve through a tensile test, shedding light on the practical aspects of material characterization.
The Tensile Testing Procedure
At the heart of determining a material’s stress-strain relationship is the tensile test, conducted using a Tensile Testing Machine, also known as a Universal Testing Machine (UTM).
This machine applies a controlled tensile force to a carefully prepared copper specimen.
The specimen, typically machined to standardized dimensions (as per ASTM standards), is securely gripped at both ends by the machine.
The machine then gradually applies a tensile load, pulling the specimen along its longitudinal axis.
Data Acquisition and Curve Generation
As the tensile load is applied, the UTM simultaneously measures two critical parameters:
- The applied force (which is used to calculate stress).
- The elongation of the specimen (which is used to calculate strain).
High-precision sensors and transducers capture these measurements in real-time.
These data points are then fed into a computer system.
The system plots the data, with stress values on the y-axis and corresponding strain values on the x-axis.
This generates the characteristic stress-strain curve for the copper sample.
Sophisticated software often accompanies the UTM, allowing for real-time curve visualization and automated data analysis.
This software can calculate key parameters like Young’s modulus, yield strength, and tensile strength directly from the acquired data.
Factors Influencing the Copper Stress-Strain Curve
The shape and characteristics of the copper stress-strain curve are not solely determined by the material itself.
Several external factors can significantly influence the results.
Understanding these factors is essential for ensuring the accuracy and reliability of experimental data.
Temperature
Temperature is a critical factor.
Elevated temperatures generally reduce the strength and stiffness of copper, leading to a lower yield strength and tensile strength.
Conversely, lower temperatures can increase strength but may also reduce ductility, making the material more brittle.
Grain Size
The microstructure of the copper, particularly the grain size, plays a vital role.
- Fine-grained copper typically exhibits higher strength and hardness compared to coarse-grained copper.
- This is because grain boundaries impede the movement of dislocations, which are responsible for plastic deformation.
Impurities and Alloying Elements
The presence of impurities or alloying elements can dramatically alter the mechanical behavior of copper.
Even small amounts of impurities can affect the material’s strength, ductility, and corrosion resistance.
Alloying elements are intentionally added to copper to enhance specific properties.
For example, adding zinc to copper creates brass, which has higher strength and corrosion resistance than pure copper.
Cold Working and Heat Treatment
Cold working, such as drawing or rolling, can significantly increase the strength and hardness of copper through strain hardening.
However, this process also reduces ductility.
Heat treatment, such as annealing, can reverse the effects of cold working, restoring ductility and reducing strength.
By carefully controlling these factors, researchers and engineers can obtain accurate and meaningful stress-strain curves for copper, enabling them to make informed decisions about material selection and design.
Key mechanical properties gleaned from the stress-strain curve, like Young’s modulus, yield strength, tensile strength, and ductility, provide invaluable insights for design and engineering. But how are these curves actually generated in the first place? The answer lies in carefully controlled experimentation, bringing us to the practical realm of material testing.
Real-World Applications and Significance: Why Understanding the Copper Stress-Strain Curve Matters
The copper stress-strain curve isn’t just a theoretical construct; it’s a vital tool in the hands of engineers and designers across numerous industries. Its predictive power allows for the creation of safer, more efficient, and more reliable products and systems.
Let’s examine some tangible examples of how this information is applied in the real world.
Electrical Industry: Ensuring Conductivity and Durability
Copper’s exceptional electrical conductivity makes it indispensable in the electrical industry.
However, conductivity isn’t the only factor at play.
The mechanical properties of copper, as revealed by the stress-strain curve, are equally critical.
For example, in designing electrical wiring, engineers need to ensure that the copper can withstand the stresses induced during installation and operation, preventing breaks or failures that could lead to power outages or safety hazards.
The stress-strain curve helps determine the appropriate gauge of wire for a given application, balancing conductivity requirements with mechanical strength.
Construction Industry: Strength and Formability in Structural Applications
In the construction industry, copper is used in various applications, from plumbing to roofing.
Understanding its mechanical behavior is crucial for ensuring the longevity and safety of these installations.
For instance, when selecting copper pipes for plumbing systems, engineers consider the yield strength and ductility of the material to ensure it can withstand internal water pressure and external loads without rupturing or deforming excessively.
The stress-strain curve also informs the design of copper roofing systems, ensuring they can resist wind loads, snow loads, and thermal expansion without buckling or tearing.
The formability indicated by the stress-strain curve is critical during the manufacturing and installation phases.
Manufacturing Industry: Optimizing Processes and Product Performance
The manufacturing industry relies heavily on copper in a wide range of products and processes.
From heat exchangers to electrical connectors, copper’s mechanical properties dictate its suitability for specific applications.
For example, in the manufacturing of heat exchangers, the stress-strain curve helps engineers determine the optimal thickness and geometry of copper tubes to maximize heat transfer efficiency while ensuring structural integrity under pressure and temperature variations.
Similarly, in the production of electrical connectors, the stress-strain curve guides the selection of copper alloys with the appropriate yield strength and ductility to ensure reliable electrical contact and resistance to fatigue failure under repeated use.
Emphasizing Safety and Performance
Across all these industries, the understanding of copper’s mechanical behavior is paramount for ensuring both safety and performance.
By carefully analyzing the stress-strain curve and selecting materials with appropriate properties, engineers can mitigate the risk of failures, extend the lifespan of products, and optimize their performance for specific applications.
Neglecting these considerations can have serious consequences, including structural collapses, electrical fires, and equipment malfunctions.
Therefore, a thorough understanding of the copper stress-strain curve is not merely an academic exercise but a fundamental requirement for responsible engineering practice.
Frequently Asked Questions: Decoding Copper
Here are some common questions about understanding the stress-strain curve of copper.
What does the copper stress-strain curve tell us?
The copper stress-strain curve illustrates how copper responds to applied force. It reveals key properties like its elastic modulus (stiffness), yield strength (point of permanent deformation), and ultimate tensile strength (maximum stress before failure). This curve is essential for predicting how copper will behave under load.
What is the significance of the "yield point" on the copper stress-strain curve?
The yield point marks the transition from elastic (recoverable) to plastic (permanent) deformation. Up to this point, copper will return to its original shape when the stress is removed. Beyond this point, permanent changes occur within the material’s structure.
How does cold working affect the copper stress-strain curve?
Cold working (deforming copper at room temperature) generally increases its yield strength and ultimate tensile strength. This is reflected on the copper stress-strain curve as a shift upwards. However, it also decreases ductility, making the material more brittle.
What are some practical applications of understanding the copper stress-strain curve?
Engineers use this information to select the appropriate copper alloy and dimensions for specific applications. This ensures that the copper component can withstand the expected stresses without failure. The copper stress-strain curve is vital in designing everything from electrical wiring to plumbing pipes.
Hopefully, you now have a better handle on what the copper stress-strain curve tells us! Go forth and use that knowledge – it’s more useful than you might think. Thanks for sticking with us!