Data analysts often employ regression analysis to model relationships between variables; however, the presence of outliers can significantly distort these models. R programming language provides numerous tools for detecting and managing these outliers, making it a vital resource for data scientists. One crucial technique is the utilization of the cook’s distance threshold, a metric assessing the influence of each data point on the regression model. Understanding and applying Frank Harrell’s guidance on model validation are important for correctly evaluating the impact of outliers. Ultimately, effectively using cook’s distance threshold helps ensure the robustness and reliability of regression analysis results.
Cook’s Distance Threshold: Spot Outliers Like A PRO!
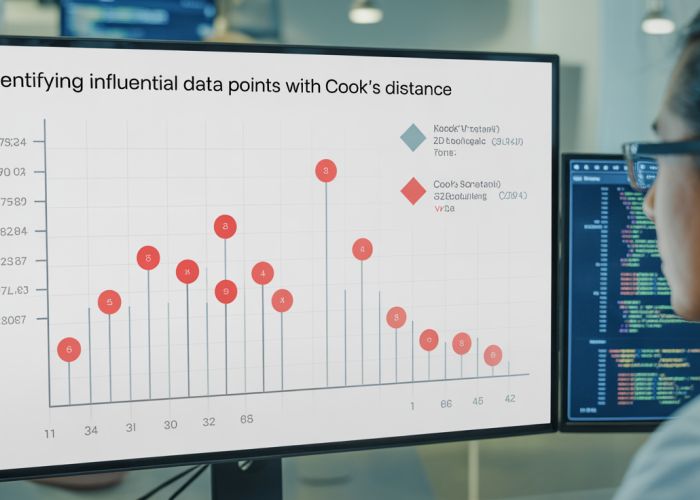
Cook’s distance is a valuable statistical measure that helps identify influential data points in a regression model. These influential points, often outliers, can disproportionately affect the model’s coefficients and predictions. This guide explores the Cook’s distance threshold and how to use it effectively for outlier detection.
Understanding Cook’s Distance
Cook’s distance quantifies the impact of deleting a single data point on the regression coefficients. In simpler terms, it measures how much the model changes when a particular observation is removed. A high Cook’s distance suggests that the corresponding observation is highly influential and potentially an outlier.
The Formula Behind Cook’s Distance
While we won’t delve deep into the mathematical derivation, it’s helpful to understand the components of Cook’s distance. The formula generally looks like this:
Di = ( (β̂ – β̂(i))T (XTX) (β̂ – β̂(i)) ) / (p * MSE)
Where:
- Di is Cook’s distance for observation i.
- β̂ is the vector of estimated regression coefficients from the full dataset.
- β̂(i) is the vector of estimated regression coefficients after removing observation i.
- X is the design matrix (matrix of predictor variables).
- p is the number of parameters in the model (including the intercept).
- MSE is the Mean Squared Error of the model.
The formula essentially measures the difference between the regression coefficients obtained with and without the i-th observation, scaled by the variance of the errors and the number of parameters.
Why Cook’s Distance Matters
Identifying outliers is crucial because they can:
- Distort the Regression Model: Outliers can pull the regression line towards them, leading to inaccurate coefficients and predictions.
- Inflate Standard Errors: This can make the model appear less statistically significant than it actually is.
- Violate Model Assumptions: Many regression models assume that the errors are normally distributed and have constant variance. Outliers can violate these assumptions.
Defining the Cook’s Distance Threshold
The Cook’s distance threshold provides a cutoff point for determining which data points are considered influential outliers. Observations with a Cook’s distance exceeding this threshold are flagged for further investigation.
Common Threshold Values
There are several rules of thumb for setting the Cook’s distance threshold. The most common are:
- 4/n: This is a widely used and easily calculated threshold, where ‘n’ is the number of observations in the dataset. Any Cook’s distance value greater than 4/n is typically considered influential.
- 1: A threshold of 1 is a more conservative approach. Using this threshold might lead to the identification of fewer outliers.
- F-Distribution Based Threshold: This approach involves comparing Cook’s distance values to an F-distribution with p (number of parameters) and n-p degrees of freedom. This method often provides a more statistically rigorous threshold.
Choosing the Right Threshold
Selecting the appropriate Cook’s distance threshold depends on the context of your data and the goals of your analysis.
- Sample Size: For small datasets, a more lenient threshold (like 4/n) might be appropriate. For large datasets, a more conservative threshold (like 1 or the F-distribution method) might be preferred.
- Domain Knowledge: Expert knowledge about the data can help in determining whether a particular data point is a genuine outlier or simply represents an extreme, but valid, observation.
- Model Objectives: If the goal is to create a highly accurate predictive model, removing influential outliers might be beneficial. If the goal is to understand the underlying process, outliers might provide valuable insights and should be investigated further before removal.
Table Summarizing Common Thresholds
| Threshold | Calculation/Description | Advantages | Disadvantages |
|---|---|---|---|
| 4/n | 4 divided by the number of observations (n) | Simple to calculate, widely used | May be too lenient for large datasets |
| 1 | Cook’s Distance > 1 | More conservative than 4/n | May miss some influential outliers, especially in small datasets |
| F-Distribution Based | Comparing Cook’s distance values to an F-distribution | Statistically rigorous, considers the degrees of freedom of the model | More computationally intensive, requires understanding of the F-distribution |
Practical Application: Identifying Outliers Using the Cook’s Distance Threshold
Here’s a step-by-step guide on how to identify outliers using the Cook’s distance threshold:
- Fit a Regression Model: Start by fitting your chosen regression model (linear regression, multiple regression, etc.) to the data.
- Calculate Cook’s Distance: Use statistical software (e.g., R, Python with libraries like statsmodels or scikit-learn) to calculate Cook’s distance for each observation.
- Determine the Threshold: Choose a Cook’s distance threshold based on the considerations outlined above (4/n, 1, or the F-distribution method).
- Identify Outliers: Identify the observations with Cook’s distances exceeding the chosen threshold.
- Investigate and Handle Outliers: Investigate the identified outliers. Are they data entry errors? Are they legitimate extreme values? Decide how to handle them based on your understanding of the data and the goals of your analysis. Options include correcting errors, removing outliers, or using robust regression techniques.
Example Scenario
Imagine you are analyzing a dataset of house prices and their corresponding square footage. You fit a linear regression model and calculate Cook’s distances. You decide to use a threshold of 4/n.
If one house has a significantly higher Cook’s distance than all other houses, exceeding the 4/n threshold, you would flag it as a potential outlier. You would then investigate this house further to determine if it is a data entry error (perhaps the square footage was incorrectly recorded) or if it is a legitimate, albeit unusual, property (perhaps it has unique features that justify its high price). Based on your investigation, you would decide whether to correct the error, remove the house from the dataset, or keep it.
FAQ: Understanding Cook’s Distance and Outlier Detection
Hopefully, this article has clarified how to use Cook’s Distance for outlier detection. Here are some frequently asked questions to further solidify your understanding.
What exactly is Cook’s Distance?
Cook’s Distance is a measure that estimates the influence of a single data point on the regression model. It helps quantify how much the model’s predicted values would change if that specific data point were removed.
How do I interpret the cook’s distance threshold?
A higher Cook’s distance indicates a greater influence. A common rule of thumb sets the cook’s distance threshold at 4/n, where ‘n’ is the number of observations. Points exceeding this threshold are flagged as potentially influential outliers.
What do I do if I find outliers using the cook’s distance threshold?
Finding outliers doesn’t automatically mean you should remove them. Investigate why they are outliers. Are they due to data entry errors, or do they represent genuine, unusual cases?
Is the cook’s distance threshold the only way to identify outliers?
No. Cook’s distance is a valuable tool, but you should also consider other outlier detection methods, domain knowledge, and visualizations to gain a comprehensive understanding of your data. A single cook’s distance threshold should not be used in isolation.
So, there you have it! Hopefully, now you feel a bit more empowered to tackle those pesky outliers using the cook’s distance threshold. Happy analyzing!